Mapping Battery Performance: An Intro to Ragone Plots

Battery Guy

Enlightened
Joined
Apr 28, 2010
Messages
807
Location
Portland, Oregon
[Message from the OP: Separate threads have been created for all Ragone Plot updates. At present, there are AA Ragone Plot and 18650 Ragone Plot threads that I am actively updating. Please refer to those threads for the most recently updated plots. I will not be updating the plots in this thread, although I will be answering general questions in this thread as they come up. Cheers- Battery Guy]

I have been inspired by the work of many CPF members to bring information to the masses. The Herculean efforts of LuxLuthor, Silverfox and others are extremely valuable for the amateur (and pseudo-pro) torch aficionados.

So I have been looking for a way that I can contribute something to the CPF in a field that I know something about: batteries. In searching the CPF archives I was surprised that there has been very little talk about Ragone plots. Ragone plots are used as a way to perform "apples to apples" comparisons between batteries of different chemistries, shapes, sizes and weights.

Much of the data in the battery shootout tests that I have seen on CPF is presented in constant capacity and/or constant resistance discharge curves. Discharge curves are great, and provide a lot of data, but you need to look a many curves plotted on several plots in order to compare large numbers of cells. In addition, the results make it difficult to assess how different cell voltages might affect performance.

Enter the Ragone plot. A typical Ragone plot shows discharge energy (Wh or mWh) versus discharge power. An example Ragone plot for three different AA cells is shown in the plot below:

PartialAARagonePlot.jpg


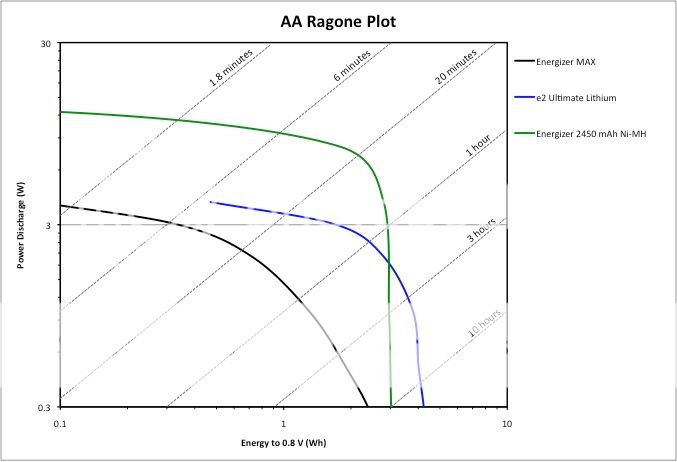
The data on this Ragone plot was collected on a Maccor cell tester using constant power discharge and measuring the discharge energy to a 0.8V cut-off. Each curve represents the results of 6-8 discharge tests.

You will also notice diagonal lines labeled with different times (1.8 minutes, 6 minutes, etc…). These lines represent run time. Finally, note that the data is plotted on a log-log scale, so relatively small differences in the curves can correspond to big performance differences.

Here are a few examples for how you can use the data on a Ragone plot:

Example 1: Let's say that you have an 8AA flashlight with a 24W bulb and you want to find the appropriate battery. This configuration would give you 3W per cell (doesn't matter what series/parallel arrangement of cells you use). Going to the Ragone plot, you can quickly see that at 3W, you will get ~6 minutes from the Energizer MAX alkaline, ~30 minutes from the e2 Energizer Lithium and ~1 hour from the Energizer 2450 mAh NiMH.

Example 2: Let's say that you want to have a run time of at least 20 minutes. Following the 20 minute diagonal line, you can see that the maximum power levels per cell will be ~2.1W for the alkaline, ~3.5W for the lithium and ~8W for the NiMH.

By studying Ragone plots, you can start to understand why there is so much variability in battery performance tests at high power. If you are testing a particular cell at power levels that are near the plateau portion of the curve (e.g. ~9W for the NiMH cell in the above plot), then it is apparent that a small shift in the position of that plot on the graph will have a huge impact on measured performance. Therefore, it is advisable to select cells that operate on the vertical portion of the Ragone curve to minimize cell-to-cell performance variability.

If you search for Ragone plots on the web, you will find that most of them actually show the relationship between specific energy/specific power (Wh/kg versus W/kg) or energy density/power density (Wh/l versus W/l). By normalizing performance to battery weight or volume, you can make real comparisons between cells of different sizes, shapes and weights.

For the time being, I am going to focus on the creation of a AA-size Ragone plot. Since all AA cells are the same size and shape, and since not too many of us care about the weight of the cells, I will leave the axes as energy versus power.

So far, I have tested and plotted data for the following cells:

Energizer MAX alkaline
Duracell Ultra alkaline
Duracell PowerPix alkaline (NiOOH cathode)
Energizer e2 Ultimate Lithium
Energizer e2 Advanced Lithium
Energizer 2450 mAh NiMH

MasterAARagonePlot6.jpg


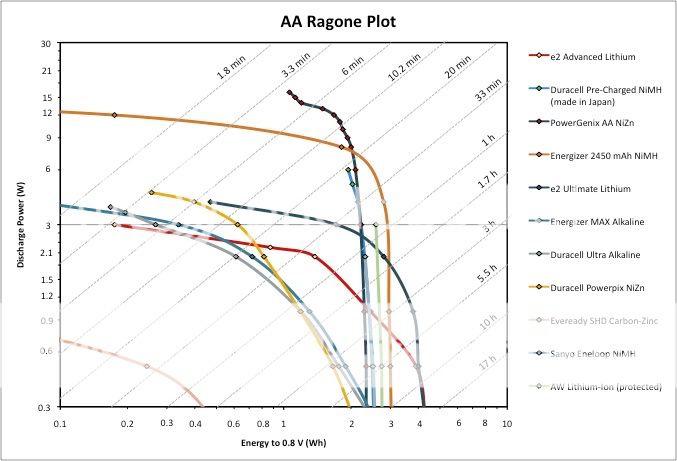
A couple of the cells are being tested at lower power levels, and I will add those results next week. I am also in the process of testing Duracell 2000 mAh pre-charged (which I believe are made by Sanyo and identical to Eneloops).

All of the above cells were purchased from Target and tested within a few days. Since I have been focusing on higher power testing, all cells were tabbed with spot-welded nickel tab stock to minimize contact resistance issues.

If you have a favorite cell that you want added, please let me know. Right now, I would prefer to test newly purchased cells only, but in the future it might be nice to look at how the performance of certain popular rechargeable cells changes with use.

Comments, criticism, suggestions all welcome. Please let me know if you find this all to be mundane and find no value in it. Last thing I want is to spend a lot of time doing something that the CPF finds no value in.

Cheers Everyone,
Battery Guy
 
Last edited:

Mr Happy

Flashlight Enthusiast
Joined
Nov 21, 2007
Messages
5,390
Location
Southern California
That's a fascinating way of presenting a lot of information in a compact form.

So it looks like the e2 Advanced Lithium has a very measurably lower performance than the e2 Ultimate variety. The maximum power output of the Advanced is about the same as an alkaline cell, but the capacity at lower power outputs is much better than alkaline. Whereas the Ultimate has higher maximum power output and over twice the capacity at moderate power outputs.

How many data points do you need to plot a reasonable curve? About 5 or so?

If we do not have a true constant power discharge tester, is it reasonable to use average power computed from the duration of a constant resistance discharge, say?
 

SilverFox

Flashaholic
Joined
Jan 19, 2003
Messages
12,449
Location
Bellingham WA
Hello Battery Guy,

Excellent work.

I have traditionally used Ragone plots to compare various chemistries when designing a battery pack, and then turned to discharge graphs with respect to time for a particular chemistry and matching cells.

It seems that the Ragone plot may be useful for that as well.

Tom
 

gswitter

Flashlight Enthusiast
Joined
Apr 26, 2006
Messages
2,586
Location
California
Excellent data! Thank you.

I'm curious to see how the Duracell pre-charged cells compare. Keep in mind, there are two different cells repackaged as Duracell pre-charged - the "Made in Japan" cells are Eneloops, and the "Made in China" cells are presumably Rayovac Hybrids. I think lots of us would be curious to see how the two compare, especially considering the Rayovacs (when not re-badged as Duracells) can be had for a quarter the price.

Other AA cells I'd be curious to see evaluated:

  • Sanyo 2700 mAh NiMH
  • Powergenics NiZn -not sure if they're the same or similar to the Duracell Powerpix Zn-Ni cells you already tested
  • Elite 1700 NiMH
  • AW 14500 protected Li-ion -I'm particularly interested in how these compare to Eneloops

And would it be possible to get a few more numerical labels on the horizontal and vertical scales?
 

Battery Guy

Enlightened
Joined
Apr 28, 2010
Messages
807
Location
Portland, Oregon
Excellent data! Thank you.

I'm curious to see how the Duracell pre-charged cells compare. Keep in mind, there are two different cells repackaged as Duracell pre-charged - the "Made in Japan" cells are Eneloops, and the "Made in China" cells are presumably Rayovac Hybrids. I think lots of us would be curious to see how the two compare, especially considering the Rayovacs (when not re-badged as Duracells) can be had for a quarter the price.

The Duracell pre-charged that are on test this weekend have a "Made in Japan" label, so I assume they are Sanyo Eneloop cells. I did not know that Duracell was also sourcing from China, so I will keep on the lookout for those. Any idea where I can buy the Chinese pre-charged Duracells?

Other AA cells I'd be curious to see evaluated:

  • Sanyo 2700 mAh NiMH
  • Powergenics NiZn -not sure if they're the same or similar to the Duracell Powerpix Zn-Ni cells you already tested
  • Elite 1700 NiMH

I have already ordered Powergenics, as I am also curious about those. The Powergenics cells have the same chemistry as the Duracell Powerpix (zinc anode, NiOOH cathode, KOH electrolyte), but the construction is different. The Powerpix cells have a bobbin construction the same as all standard alkaline cells, whereas the Powergenics cells are spiral-wound like all NiMH cells. The spiral-wound construction increases electrode surface area (which decreases current density on the electrodes), reduces diffusion distance of ions, and therefore results in higher power capability.

  • AW 14500 protected Li-ion -I'm particularly interested in how these compare to Eneloops

Not familiar with these, but they would be a great addition. Where can I buy them?

And would it be possible to get a few more numerical labels on the horizontal and vertical scales?

I know, I know. I made these plots on Excel and I am having a tough time getting more labels. If I cannot do it automatically, I will add the labels manually and group them with the plot. That will work well as long as nobody wants me to rescale the axes.

Cheers,
Battery Guy
 

Battery Guy

Enlightened
Joined
Apr 28, 2010
Messages
807
Location
Portland, Oregon
So it looks like the e2 Advanced Lithium has a very measurably lower performance than the e2 Ultimate variety. The maximum power output of the Advanced is about the same as an alkaline cell, but the capacity at lower power outputs is much better than alkaline. Whereas the Ultimate has higher maximum power output and over twice the capacity at moderate power outputs.

Agreed. What you cannot see from the posted plot is that at lower discharge power levels the Advanced Lithium is identical to the Ultimate Lithium. My guess is that both the Advanced and Ultimate use the same electrodes, but the Ultimate uses a lower resistance (and more expensive) separator. Hence the lower price for the Advanced versus the Ultimate.

How many data points do you need to plot a reasonable curve? About 5 or so?

I like to get somewhere between 5 and 8 points. The hard part is selecting the power levels before the test. Most of the data needs to be in the range where the curve begins to plateau in order to get nice, smooth plots.

If we do not have a true constant power discharge tester, is it reasonable to use average power computed from the duration of a constant resistance discharge, say?

Unfortunately, the hard answer is "no". That being said, you can make exceptions if you stay within the same cell chemistry. For example, most of Silverfox's data on alkaline cells could be plotted as log capacity versus log current. This would be a valid way of representing that massive amount of test data on one plot.

Cheers,
Battery Guy
 

Battery Guy

Enlightened
Joined
Apr 28, 2010
Messages
807
Location
Portland, Oregon
Hello Battery Guy,

Excellent work.

Thanks, but I have a long way to go to catch up to you!

I have traditionally used Ragone plots to compare various chemistries when designing a battery pack, and then turned to discharge graphs with respect to time for a particular chemistry and matching cells.

It seems that the Ragone plot may be useful for that as well.

Tom

Agreed. A lot of the constant current discharge data that you have posted on CPF could be plotted in a similar way (log Ah vs log A), and it would be very useful as long as you compare cells within the same chemistry family (i.e. same operating voltage).

Cheers,
Battery Guy
 

Burgess

Flashaholic
Joined
Apr 10, 2006
Messages
6,548
Location
USA
to Battery_Guy --


Good Work ! ! !


:wow::goodjob::thanks:


Oh, and by the way . . . .

Welcome to CandlePowerForums !


:welcome:
_
 

45/70

Flashlight Enthusiast
Joined
Oct 9, 2005
Messages
2,800
Location
Rural Ohio
Interesting plots, Battery Guy. Information overload is always welcome here. :) There are many types of cells I'd like to see graphed in this manner, but I'll let the general populace be your guide, as most members likely aren't interested in NiCd, or carbon zinc cells, for example.

Keep up the good work! :thumbsup:

Dave
 

Battery Guy

Enlightened
Joined
Apr 28, 2010
Messages
807
Location
Portland, Oregon
... as most members likely aren't interested in NiCd, or carbon zinc cells, for example.

Well, I for one am still interested in NiCd for high power applications, so let me know if there is a specific cell you want tested.

With respect to carbon-zinc, I actually have some test data on Eveready SHD (Super Heavy Duty) cells that I can add to the AA Master Ragone Plot. However, since I am focusing on higher power drains, I am afraid you won't see a lot of data on these Ragone plots for carbon-zinc.

Cheers,
Battery Guy
 

Mr Happy

Flashlight Enthusiast
Joined
Nov 21, 2007
Messages
5,390
Location
Southern California
Just for fun, I have correlated the performance data I have measured for NiZn rechargeable cells and computed a predicted Ragone plot for such a cell:

aaragoneplot.png


As and when you get to actually measure one of these cells, it will be interesting to see how closely my prediction matches your results.
 

Battery Guy

Enlightened
Joined
Apr 28, 2010
Messages
807
Location
Portland, Oregon
Just for fun, I have correlated the performance data I have measured for NiZn rechargeable cells and computed a predicted Ragone plot

whoa, that is much higher power capability than I expected from that cell. Pretty impressive actually. I suspect that your estimated numbers will be very close to the actual constant power measurements since the NiZn cells have relatively flat discharge curves. Also, I notice that the total energy that you measured is around 2.25Wh, which is pretty close to the rated value for these cells.

Any idea how the self-discharge rate on the Powergenix compares to the Eneloop cells? It should be at least equivalent, if not better, but it would be great to see data.

I should get my Powergenix cells on test on Monday or Tuesday, and will have the plot added to the master AA Ragone plot by the end of next week.

Cheers,
Battery Guy
 

Mr Happy

Flashlight Enthusiast
Joined
Nov 21, 2007
Messages
5,390
Location
Southern California
whoa, that is much higher power capability than I expected from that cell
Yes, it does seem like quite a high number. The high power portion of my curve is the least certain part of it and may be a little optimistic compared to actual cell performance.

I generated the curve by constructing a model of the cell and then running simulated constant power discharges on that model.

As to the maximum power output, here are some figures. During the first third of the discharge the cell holds an EMF of over 1.7 V and has an internal resistance of about 30 milliohms. If we match the cell with a 30 milliohm load the expected discharge current would be 1.7/0.06 = 28 A. That current would deliver a power into the load of about 28^2 x 0.03 = 24 W.

The uncertainty is that I don't have a practical way to short out a cell and see if it really can deliver 28 A into a load. I would need a DC clamp meter that I don't have.

Even if the maximum figures are a bit optimistic, there is no doubt that these cells pack quite a punch.
 

Mr Happy

Flashlight Enthusiast
Joined
Nov 21, 2007
Messages
5,390
Location
Southern California
Any idea how the self-discharge rate on the Powergenix compares to the Eneloop cells? It should be at least equivalent, if not better, but it would be great to see data.
Self-discharge seems to be very low. I have some cells that came off the charger a week or so ago at 1.83 V. I measured them just now and found them reading 1.81 V. I might leave them a bit longer before I do a discharge test, but the indications are good that they are holding their charge.
 

45/70

Flashlight Enthusiast
Joined
Oct 9, 2005
Messages
2,800
Location
Rural Ohio
Data for Eveready Super Heavy Duty (SHD) has been added to the Master Ragone plot:

Heh, cool!

What I meant was that some of the cells I'd like to see plotted, are more just out of curiosity than actually needing to know. NiCd cells are a bit different, as I still much prefer using them over NiMH's for tool packs and such. They are much sturdier under abusive conditions encountered in such devices, and while their per charge performance may lack in runtime, they actually seem to have more "oomph" and last a lot longer in the long run than NiMH cell packs. Still, my interest in seeing a plot, is mostly just out of curiosity.

I suppose the most interesting sizes in NiCd, to me anyway, would be "A" and 5/4 "A" (Edit: I meant 4/3 "A", I had "AAA" sizes on my mind for some reason), or similar. If you happen to run into any of those, that'd be cool. Again, no big deal, as I said, I don't want to request types that most here probably aren't interested in.

Just for fun, I have correlated the performance data I have measured for NiZn rechargeable cells and computed a predicted Ragone plot for such a cell:

Cool Mr H! :thumbsup:

Dave
 
Last edited:

gswitter

Flashlight Enthusiast
Joined
Apr 26, 2006
Messages
2,586
Location
California
The Duracell pre-charged that are on test this weekend have a "Made in Japan" label, so I assume they are Sanyo Eneloop cells. I did not know that Duracell was also sourcing from China, so I will keep on the lookout for those. Any idea where I can buy the Chinese pre-charged Duracells?
Until recently, the Chinese cells were much more common around here than the Japanese. The last time I was in Costco (two months ago), they had crates of the Chinese, and just a single pack of the Japanese. My local RiteAid pharmacy had equal amounts of both a couple weeks ago. I was in the local Office Depot a week ago, and all they had was the Chinese cells. And in my local Target tonight, all the AA's were Japanese and the AAA were equal amounts of each.

In general, you can identify the different cells by the ring of shrink wrap around the button (Japanese are white, Chinese are black), but I don't know if this is always true. The individual cells will be labeled "Made in..." in either case.

Not familiar with these, but they would be a great addition. Where can I buy them?
You can get the AW 14500 protected Li-ions direct from AW or domestically (quicker shipping) from Lighthound.

Thanks for adding the extra labels to the graph. I'd be curious to see NiCd results as well
 

Battery Guy

Enlightened
Joined
Apr 28, 2010
Messages
807
Location
Portland, Oregon
Greetings Everyone,

I have PowerGenix NiZn AA cells arriving tomorrow (Monday), and Duracell pre-charged (made in Japan) cells on test now. I also have the following cells on order (by popular demand):

Elite 1700mAh NiMH
Sanyo 2700mAh NiMH
Sanyo 2500mAh NiMH
Duracell 2650mAh NiMH
AW 900mAh lithium-ion
Sanyo NiCd (various high rate and standard)

This should keep me busy for a few weeks.

Now, we need to discuss charging protocols for the NiMH and NiCd cells. My preference is to use the "old standby" charge protocol of C/10 for 15 hours. Although this method is slow, it pretty much insures that the cells reach 100% SOC. This rate is also essentially the same as that printed on the Duracell pre-charged cells (200mA for 16 hours). Given that I will be testing a wide range of NiCd and NiMH cells, does anyone see a problem with the C/10 for 15 hour charge protocol?

Also, there is the issue of "break-in". I recommend that I cycle the cells until I do not see any significant improvement in capacity. Specifically, I propose that the cells be cycled with a C/4 discharge rate and a charge protocol similar to above, until two consecutive discharge cycles have a difference of <2% in capacity. Once that happens, I will start the high power testing. Sound reasonable?

For the Powergenix NiZn, I will use a similar break-in protocol, but using the charge profile on the AA Powergenix spec sheet (CC 0.75A to 1.9V, CC 1.9V to 0.075A).

It is going to take me awhile to get this data, so be patient. I hope to add one or two cells to the Master Ragone plot each week.

Cheers,
Battery Guy
 

45/70

Flashlight Enthusiast
Joined
Oct 9, 2005
Messages
2,800
Location
Rural Ohio
It is going to take me awhile to get this data......

DUH! That's quite an undertaking there BG! :thumbsup:

The "standard charge" referred to on the labels of nickel based cells, is in fact a reference to the IEC 61951 evaluation "standard" used to determine the cell's capacity that is printed on the side of the cell. So, yes that would be the way to go about it. :) A lot of folks believe that the "standard charge" is a reference as to how the cell is supposed to be charged normally, which it is not, except when determining the cell's capacity per IEC standards.


As for NiZn, I don't know any other way to go about it. They're so new you're going to have to go by what the manufacturer suggests, unless someone else knows another way that is more proper.

This should keep me busy for a few weeks.
Ya, I'll bet! Nice job BG!

Dave
 
Top