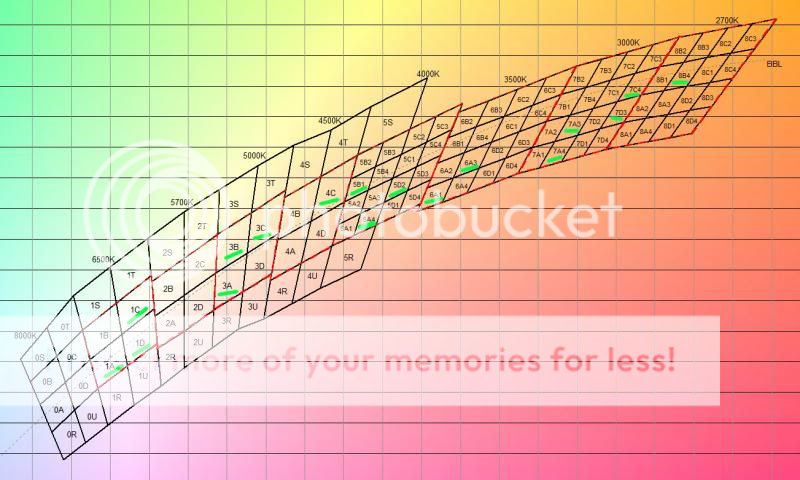
If we draw a line and then find the midpoint between two points on a black body curve (in a CIE color coordinate graph), the midpoint will be a little off from the color coordinates of the correlated color temperature for that point.
Which would make the tint slightly magenta, when you combine a higher and a lower color temperature source together.
Merging averages is a funny business, and a great time to talk about my favorite statistical fallacy,
Simpson's Paradox. In short, if we have a true statement about two or more subgroups of a population, and combine the data without care for an unmeasured variable, we will make a false statement about the whole population or measure. So it is possible to show that, with all of its six departments slightly in favor of women, Berkeley selects against women, or that given six age categories of smoker and nonsmoker deaths, that smokers live longer. Still, there are tools available to look at the whole population or data - Modeling or survey.
I just plain wouldn't know HOW to model-average different spectra together, except to get a Spectral Power Distribution for both sources, superimpose them, and then evaluate the locus in the color space I could set that output in. Otherwise, I would have to build the light, and test it, and decide if it is adequate. I have done this previously with Cree XR-Es and gotten light I liked. It works with LED strips and fluorescent lamps, too.

")