DHart
Flashlight Enthusiast
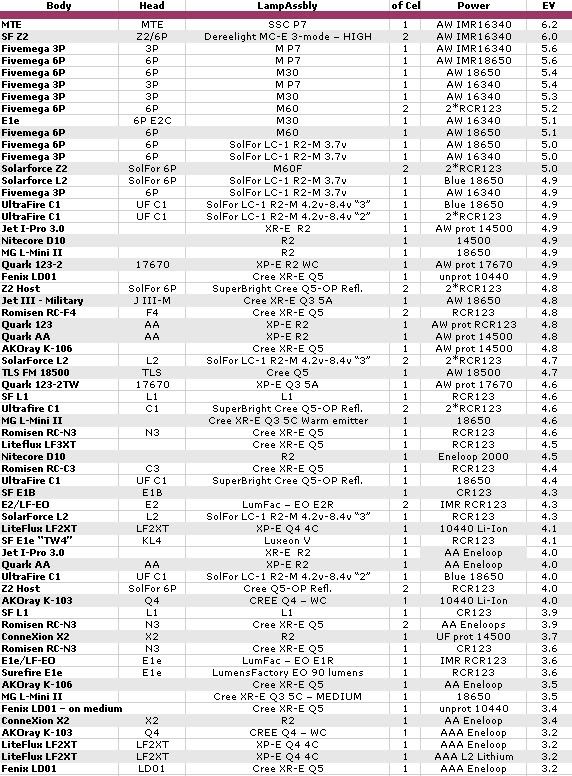
This is an update to a chart I posted some time ago. Thought some might find it useful in comparing outputs of some lights. All were tested in ceiling bounce mode and measured in EV. Margin of error about .1EV, so lights measuring only .1EV apart may be considered to have relatively equal measured output. A change of 1.0 EV represents a doubling (2x) or halving (.5x) of measured light output. An increase of 2EV represents a quadrupling of output (4x). For example a change from EV 4.2 to 4.7 represents a 50% increase in measured output, etc. Several lights appear more than once on the chart with changes in cell chemistry, selected level, etc.


Last edited:

