Question about run-time graphs

GearDog

Newly Enlightened
Joined
Feb 2, 2012
Messages
22
Location
Ohio
It took me a while to see the significance of the graphs produced by Selfbuilt, but now I have some questions about them, and did not find answers on his website. I'm looking at the graphs, and see different patterns. For a given LED light, some start with a peak lumen output that falls quickly after a few minutes. Others have a flatter declining slope. I cannot tell if the run time graph is only applicable to a continuous use of the light until it runs dry, or whether it also reflects the use of the light over a series of uses with the same batteries. A roller coaster metaphor comes to mind to explain two ways the graphs may apply to normal use of the flashlights.

Interpretation 1: You turn on the light when it is fully charged (for example, X=0 on the graph, Y=10), you leave it on high/max, and a few minutes later, it begins to drop in output level (X=3, Y=7). You turn off the light (X=3, Y=7), but when it you turn it back on, it picks roughly where you left off on the slope function (X=3, Y=7), and the drain continues to follow the run-time graph pattern. It's like you are riding a roller coaster from the top of the hill, and each time you turn off the light, the coaster stops on the tracks and you get off. When you turn on the light again, you get back in the roller coaster car at the same place you left off, and continue to ride down the remainder of the slope, until you want to get off, then the car stops again.

Interpretation 2: You turn on the light and it starts at some peak output level for fully-charged batteries (X=0, Y=10). Each time you turn back on the light, you go back to X=0 on the graph, although you may start at a lower peak starting level (Y<10) because the battery has lost some charge since your last use. On this roller coaster, you ride it down the slope until you decide to get off. When you get back on, the roller coaster has moved back to top of the hill, and you ride it back down the hill again. (The metaphor probably breaks down because the batteries lose charge, and so even though you are starting from the top of the hill when you turn on the light each time, the hill is not as high as it during the last ride, even though the downward slope of the hill is the same).

Are either of these an accurate way of understanding the run time graphs? :confused:
 
Last edited:

reppans

Flashlight Enthusiast
Joined
Mar 25, 2007
Messages
4,873
Selfbuilt's graphs are as simple as this.

...the run time graph is only applicable to a continuous use of the light until it runs dry...

Turn the light on, and data-log the lumen output over time until the output drops below 50% (ANSI allows to 10%).

Turning on/off as in your first scenario (which is more real world than a continuous run) should improve the graph as it allows the LED/driver to cool (better efficiency) and battery to recover, although low resistance batteries like Li-ions/NiMhs should only slightly benefit from recovery, while alkalines should benefit significantly from recovery.
 

GearDog

Newly Enlightened
Joined
Feb 2, 2012
Messages
22
Location
Ohio
Selfbuilt's graphs are as simple as this.

Yes, I saw that last sentence but I could not decide what he meant by "recovery" so I generated a couple of different interpretations.

Does recovery mean moving back up the slope a bit, or starting at the top of the slope, with a smaller Y-intercept than initially?

Specifically, I"m wondering about the MM15. It drops down very quickly from the peak of 5000stock/7000vn. Does that mean when you turn it back on again after previously using a few minutes in turbo, you can run it again at that super high output level? Or are you more likely to run below 4500 for the rest of the battery life?
 

reppans

Flashlight Enthusiast
Joined
Mar 25, 2007
Messages
4,873
Ahh, now I see what you are talking about. First off, I've never seen him do this before (as he said it's an "experiment") - but I have done something similar myself with the Preon Penlight and alkalines and posted the improved runtime results in his review thread of that light. No stepdowns involved so this was all about battery recovery and a cooler more efficient head.

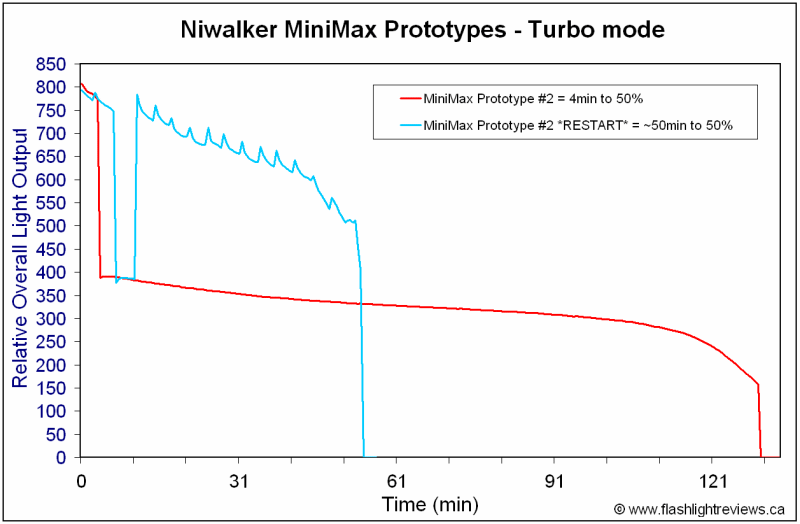
Anyways, from my quick skim of the review, your interpretation 1 applies. He shuts down at x=3 y=7 waits 10 mins and starts up (re graphs) at x=3 y=7.5, then shuts down at x=4 y=6, then restarts 10 mins later at x=4 y=6.5, and so on. Each 0.5 blip up on y axis at restart represents a slightly higher lumen output than when he shut down. The slightly higher output is a result of the LED/driver cooling (more efficient) and the battery voltage recovering following a heavy draw (as I mentioned above). The cycle repeats and it graphs the ocean wave pattern you see.

I think in your last question, you are asking about the stepdown, which manufacturer's use to prevent over heating. I didn't read the whole review, but a stepdown is usually timer or temperature controlled. Timer stepdowns can usually be fooled by turning the light off and back on which brings the light back up to full power - yes you can run turbo almost continuously this way but you'll eventually burn the light up. You can't fool a temperature controlled stepdown that way though - don't know which this light has and since SB waited 10 mins between runs, plenty to cool down, it's going to start at max turbo everytime (of course with degrading output as the batts deplete).

Another way to look at it is this - assume a 1000 lm light steps down in 1 min to 500 lms and the runtime spec is 1 hr (which includes 59 mins at 500). Well, in the real world, most people only use turbo for seconds at a time so in reality most people will only get 30mins of cumulative runtime from that Turbo because it will never stepdown (twice the lumens, half the runtime).

Hope that helps ... Going to bed now :).
 
Last edited:

shelm

Flashlight Enthusiast
Joined
Dec 8, 2011
Messages
2,047
Are either of these an accurate way of understanding the run time graphs? :confused:

flat line graph => interpretation2 holds true

steep slope graph => interpretation1 holds true
 
Last edited:

RobertMM

Flashlight Enthusiast
Joined
Jan 21, 2014
Messages
1,085
Location
Las Piñas, Philippines
This reminds me of the graph posted at LedResource IIRC, which shows a review of the Minimag Pro that includes 2 graphs: one that shows continuous runtime til cell depletion, and another graph with the light operating in duty cycles of 15min each(turn on for 15min, the off. The start for another 15min and so on until battery depletion).
Such a graph shows the ability of cells to recover and would be more realistic in showing how the light would perform with "real" use.
 

reppans

Flashlight Enthusiast
Joined
Mar 25, 2007
Messages
4,873
... Both interpretation1 and interpretation2 can be true, it really depends on the flashlight model. But as reppans indicated, in a really modern flashlight, say Fenix or Foursevens, interpretation2 is the more common case....

I don't understand interpretation 2 where the graph resets to back to x=0 every activation. This graph would just look like a series of ladder rungs protruding from the y=0 axis line. Selfbuilt's graphs are always going to have cumulative runtime for a given battery extending across the x axis.
 

shelm

Flashlight Enthusiast
Joined
Dec 8, 2011
Messages
2,047
flat line graph => driver stabilizes output => interpretation2 holds true

steep slope graph => poor driver, unregulated output, Maglite like => interpretation1 holds true
 
Last edited:

reppans

Flashlight Enthusiast
Joined
Mar 25, 2007
Messages
4,873
Have you seen the new graph SB is using, I think the OP is referring to?

MiniMax2-restart.gif
 

Overclocker

Flashlight Enthusiast
Joined
Aug 13, 2005
Messages
1,585
Location
Philippines
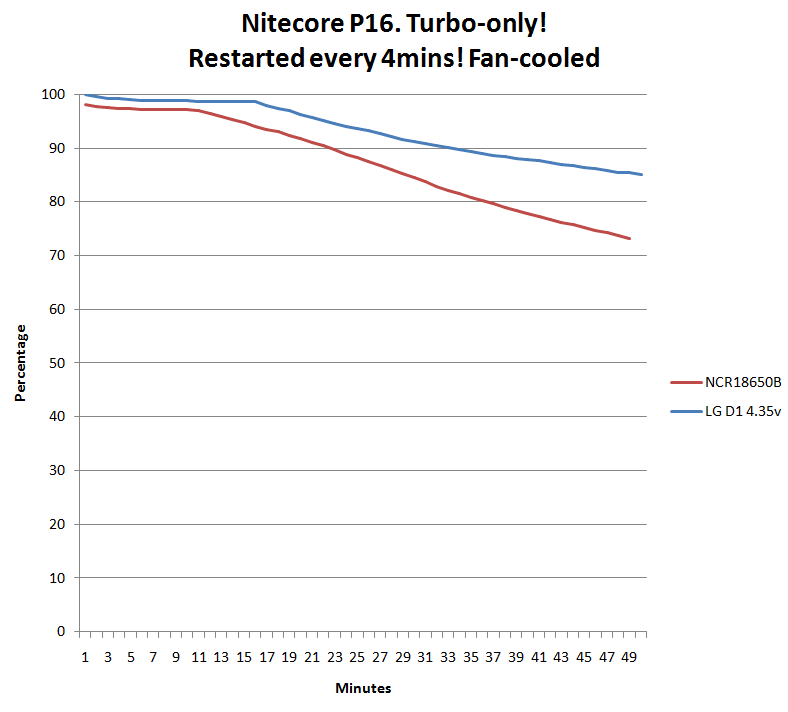
well sometimes selfbuilt would include a graph, but most often not, of a light being restarted right after the timer stepdown. single-cell buck-only flashlights are usually NOT able to attain full brightness once the cell voltage goes down a bit (i.e. fall out of regulation). multiple cells in series usually go a much better job

here's my investigation into the issue. it's actually quite ridiculous how all these 900+ lumen flashlights fall out of regulation in just 10minutes

FbPc2xs.png
 

GearDog

Newly Enlightened
Joined
Feb 2, 2012
Messages
22
Location
Ohio
Yes these are all helpful posts. I did not see that RESTART graph before. That's what I was hoping for!
 
Last edited:
Top