Log-Log Plot for Comparing Lumens - Run Time - Models?

Brooke

Newly Enlightened
Joined
Nov 9, 2007
Messages
25
Location
Ukiah, CA
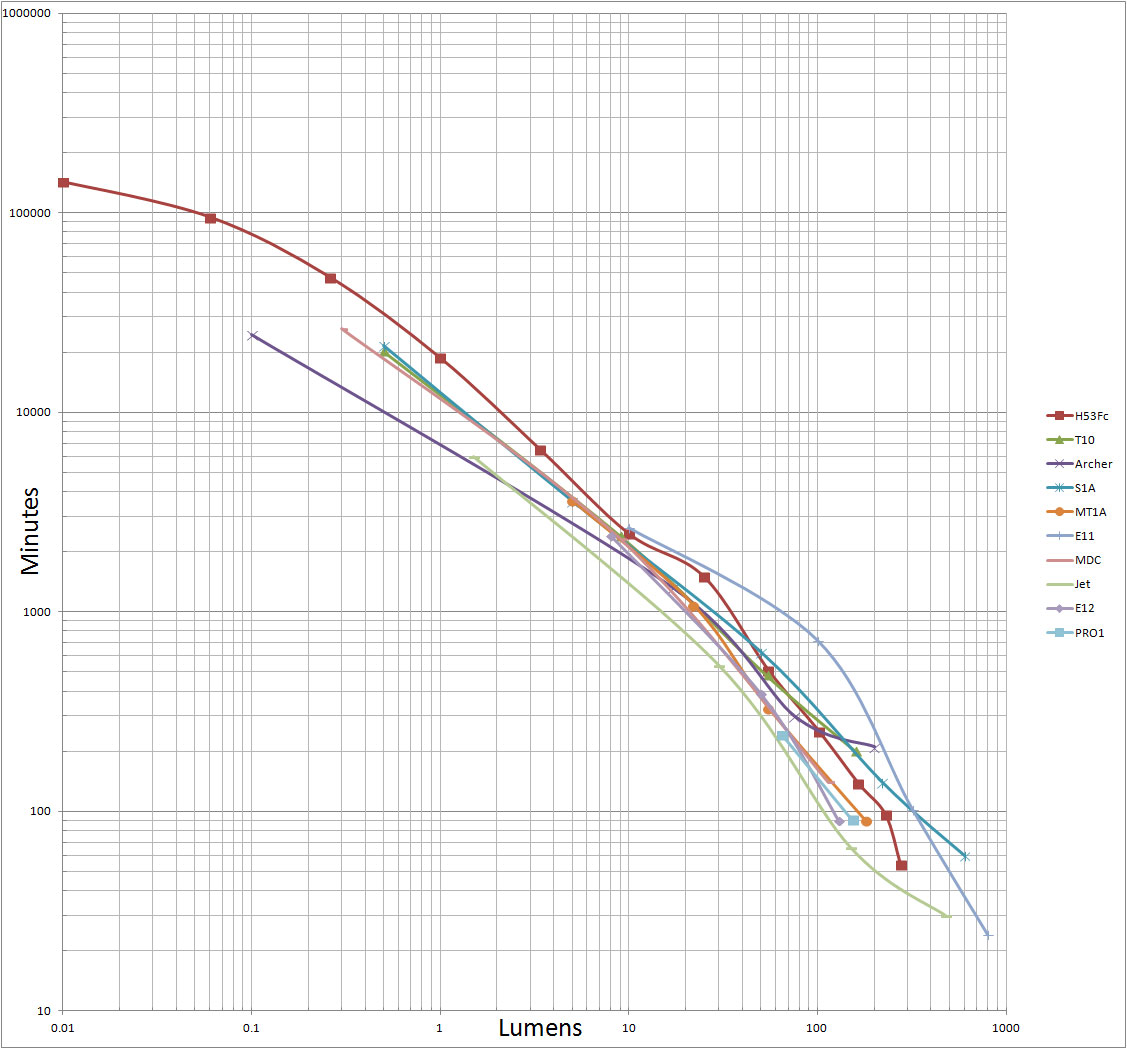
Hi: I've been trying to figure out which single AA flashlights are the most energy efficient. I started with a scatter plot of 70 some odd lights that used AA cells but it's not fair to compare lights with different battery capacity. Also needed to use LOG(Lumens) & LOG(Minutes) to get some separation between lights. So made a plot of only single AA lights and then of only lights that seemed better in terms of Lumens & Time. A table of all the lights is at: https://prc68.com/I/FlashlightPat.shtml#BL-Table

The below plot is based manufacturer's data. Is this a valid way to compare efficiency?
This plot is also at: https://prc68.com/I/FlashlightPat.shtml#BL-Plot
Lumen-Min-Modb.jpg
 

bmengineer

Newly Enlightened
Joined
Jan 26, 2018
Messages
142
Location
Ontario, Canada
I'm not clear on this, does minutes indicate the advertised runtime at that mode, or is this a log-log of an actual runtime test? If it's the former, step downs make this chart fairly meaningless for any non-constant mode.
 

archimedes

Flashaholic
Joined
Nov 12, 2010
Messages
15,780
Location
CONUS, top left
Hi: I've been trying to figure out which single AA flashlights are the most energy efficient....

The below plot is based manufacturer's data. Is this a valid way to compare efficiency? ....

No, for a few different reasons.

There is a CPF member @reppans who has done some detailed testing, so searches for his postings may provide more info and insight.
 
Last edited:

archimedes

Flashaholic
Joined
Nov 12, 2010
Messages
15,780
Location
CONUS, top left
Even if you stipulate that advertised output and runtime info is "accurate" :) the shape of the curve (regulation) is highly relevant.

The ANSI-FL1 standard is determined by continuous runtime until the light output drops to 10% of the initial value, as measured 30 seconds after turning the light on.

You can easily imagine two very different curves with the same start- and end-points (same "output" and "runtime" then) ... but very different total "lumen-hours" and thus markedly different efficiency.
 

xxo

Flashlight Enthusiast
Joined
Apr 30, 2015
Messages
3,006
You need to compare runtime graphs - the one with the biggest area under the curve is your winner. Of course the AA cells used need to be the same for all graphs.
 
Top