CPF brightness charts/plots

NewBie

*Retired*
Joined
Feb 18, 2004
Messages
4,944
Location
Oregon- United States of America
As I recall, the human eye sees logarithmically.

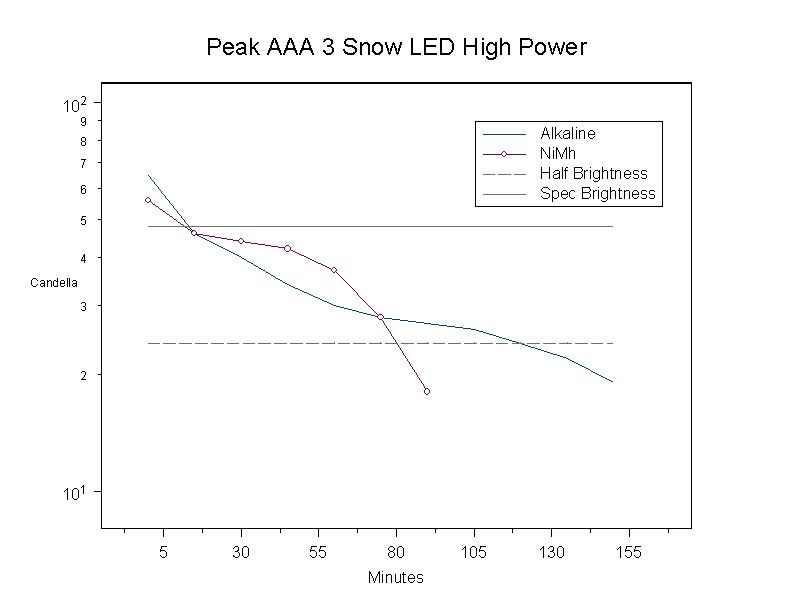
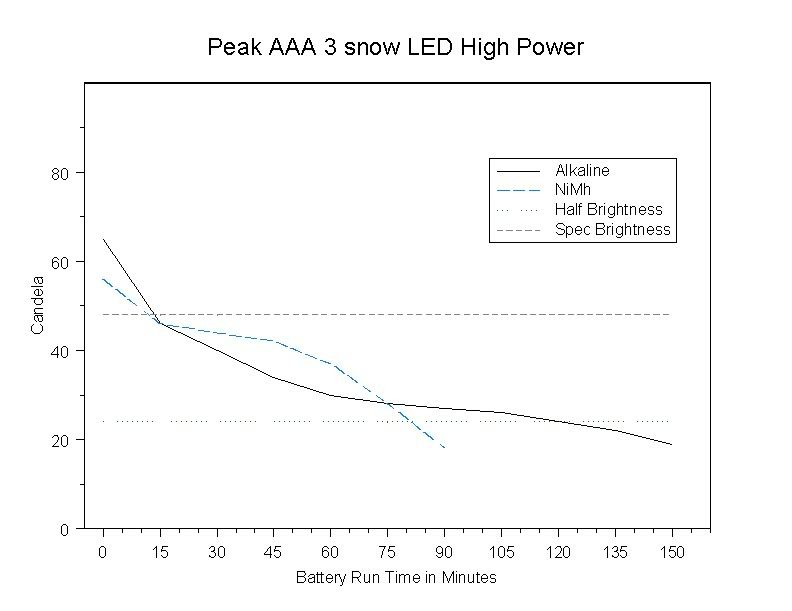
I often wonder why we always plot lux as linear, since it makes the flashlight look like it varies much more than it really does to our eyes.

In comparision plots, between two flashlights, a logarithmically plotted result would also more faithfully show the real difference between them as it appears to your eye in "real life".

It seems to be quite misleading to utilize a linear lux/candela plot.

Could the more educated folks here please explain to me why we utilize linear plots for lux/candela?
 

nerdgineer

Flashlight Enthusiast
Joined
May 7, 2004
Messages
2,778
Location
Southern California
I dunno why...probably out of habit, like nautical miles or measuring audio amp outputs in watts. That said, having linear lumens does help for those who care about run time/efficiency/power and those kinds of calculations. I mean, you have to do the log/linear conversions somewhere when looking at all this, so it happened to be at the eyeball response.
 

SilverFox

Flashaholic
Joined
Jan 19, 2003
Messages
12,449
Location
Bellingham WA
Hello NewBie,

Just for you...

Log scale

LogPeakBattery.jpg


Linear scale

Peakbattery.jpg


Tom
 

Doug S

Flashlight Enthusiast
Joined
Jun 20, 2002
Messages
2,712
Location
Chickamauga Georgia
[ QUOTE ]
NewBie said:
As I recall, the human eye sees logarithmically.


[/ QUOTE ]
Doug, I have seen this statement repeated a lot but I am not so sure it is true. I presume that "seeing logarithmically" means perception of brightness is logarithmic w.r.t. photometric intensity. That is certainly not my personal experience. Perhaps this "seeing logarithmically" is a confusion with hearing where perceived loudness is logarithmic w.r.t. power.

EDIT: Thinking about this further, any assertion that perception of brightness is logarithmic w.r.t. photometric intensity should also specify what base the log is take to. Is a linear relationship not the same as logarithmic w.r.t. base 1? Earlier I was thinking in terms of base 10 which is completely arbitrary but is a common bias of my species based upon the combined digits of two hands. It is generally taken that perceived loudness is logarithmic w.r.t. power to base 10. When you think about it, this is really an odd coincidence. I suppose that perception of brightness could be logarithmic w.r.t. photometric intensity for a standard observer using a fairly low base. For me, that base would likely be less that e [natural log].
 

Roy

Farewell our Curmudgeon Administrator
Joined
Apr 14, 2002
Messages
4,465
Location
Granbury, Tx USA
I was taught in the US Army Nuclear Power School that most things in nature changed by log base e (Natural Log)

My plots are all linear because my plotting program does not give me any choice in the matter. The horizontal axis is always time which is linear. If the veritcal axis were log (base 10 or e) there would be no zero light output.
 

jtice

Flashaholic
Joined
May 21, 2003
Messages
6,331
Location
West Virginia
I am currently setting up a nice excel Runtime Chart Template.

I have a couple questions....

One, how are you guys setting up excel?
Do you tell it fo smooth the lines? I hate seeing the make sharp angles, and use straight lines.
But, I noticed that telling it to smooth the line, can make inaccurate charts, such as a line dipping down, and then back up to the next data point.

I am going to make mine average in any blank cells, IE,,, if you are manually logging stuff, and you forgot to log the 15 minute mark, it will average the 10 and 20 minutes mark to get the 15 min mark, etc.
But, how should it average them? I have heard I can also use a .... damnit, i forget what its called. Quad somethign or other...

Basically, I am trying to get the lines alittle more smooth and natural, without using the excel smooth command, and without making the lines display inaccurate info.

-John
 

NewBie

*Retired*
Joined
Feb 18, 2004
Messages
4,944
Location
Oregon- United States of America
Doug_S:

Please refer to this chart of the human eye response:
http://hyperphysics.phy-astr.gsu.edu/hbase/vision/bright.html

"Psychochophysical experiements indicate that the perceived brightness increases approximately as the logarithm of the luminus flux. With a doubling of the flux leads to an increase of about 1.5 units" on the chart.


Additionally, the magnitude of a star/planet as percieved by the human eye results in an apparent magitude of five magnitudes, even though it is 100 times less bright.

Information on this is found here:
http://www.wordiq.com/definition/Apparent_magnitude
 

jtice

Flashaholic
Joined
May 21, 2003
Messages
6,331
Location
West Virginia
Here is an exampl of what i am trying to get rid of.
Notice at 95 Minutes, the lux curve goes down, thenm back up to the 100 minute mark?
That is due to the smoothing effect you can have excel do, that is what I am trying to get rid of, seeing how that is NOT what the lux acually did.

runtime_chart3.jpg
 

jtice

Flashaholic
Joined
May 21, 2003
Messages
6,331
Location
West Virginia
ADDITION..... to solve this problem,, it will serve two purposes,, I want to be able to fill in any data points I want,, and leave what ever ones I want blank,,, and I want excel to average in any blank fields.

Anyone know a way to do this?
I kinda know a way, but its gonna involve a few complicated steps,

-John
 

jtice

Flashaholic
Joined
May 21, 2003
Messages
6,331
Location
West Virginia
ok, this might help you guys understand what i want to do.

Theres 2 things i want to do to this.

1. Doesnt excel have a feature, that will connect the broken parts of the graph? Where the cells are empty?

2. I want to make it average in all the blank cells.
If I figure this out, I dont need #1 to work, cuz this will be doing the same thing, but better, becuase it will actually be filling in the blank cells also.

http://www.jtice.com/charts/runtimes/Runtime_Template2.xls
 

greenLED

Flashaholic
Joined
Mar 26, 2004
Messages
13,263
Location
La Tiquicia
Well...let me guess: our eyes may perceive differences in light intensity logarithmically, but light intensity from a light source decreases linearly with time (assuming unregulated light source)? Thus, we graph change in light source intensity, not change in light perception... out of habit? /ubbthreads/images/graemlins/icon3.gif

Just a guess, but I see a lot of other instances where what/how we perceive things have nothing to do with how they actually occur.
 

jtice

Flashaholic
Joined
May 21, 2003
Messages
6,331
Location
West Virginia
yea yea, just sit there snacking, while *I* do all the work /ubbthreads/images/graemlins/wink.gif
 

NewBie

*Retired*
Joined
Feb 18, 2004
Messages
4,944
Location
Oregon- United States of America
[ QUOTE ]
greenLED said:
Well... our eyes may perceive differences in light intensity logarithmically, but light intensity from a light source decreases linearly with time?

Just a guess, but I see a lot of other instances where what/how we perceive things have nothing to do with how they actually occur.

[/ QUOTE ]

Explain your reasoning?
 

greenLED

Flashaholic
Joined
Mar 26, 2004
Messages
13,263
Location
La Tiquicia
I just edited my post while NewBie posted. So here's another try:

Assuming an unregulated light source (flashlight), light intensity should decrease (more or less) linearly as the energy stored in the cell decreases. This would be like filling some container with water and poking a hole in the bottom. The water would drain out of the container slowly.

Our eyes, as per your initial post, perceive light changes in a logarithmic fashion. I am not familiar with the mechanism behind this. If we accept this as a true statement, then we could think of our light perception as set up in "steps". Back to the bucket analogy, we would only notice the water level changing once the level went down dramatically (on a log scale). For my purposes, let's assume we can only notice a change in water level when the bucket is full, 3/4-full, 1/3, and empty.

So, although the water drains constantly out of the bucket (linearly), we can't really notice any change in the water level until it is very drastic (along a log scale). This would be consistent with CPF's notion that we can see a definite decrease in light intensity when a light reaches 50% of its full output.

Did that clarify your question?
Edited again.
 
Top