
Warning: pic heavy, as usual. 
This is a review of the 1xAA L3 Illumination L10 – available with either a XP-G2 R5 (Cool White) or the Nichia 219 4500K 92CRI (Neutral White).
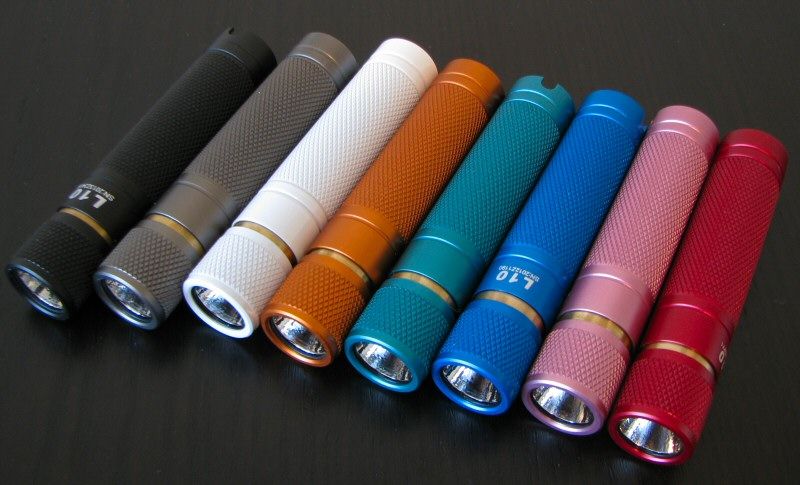
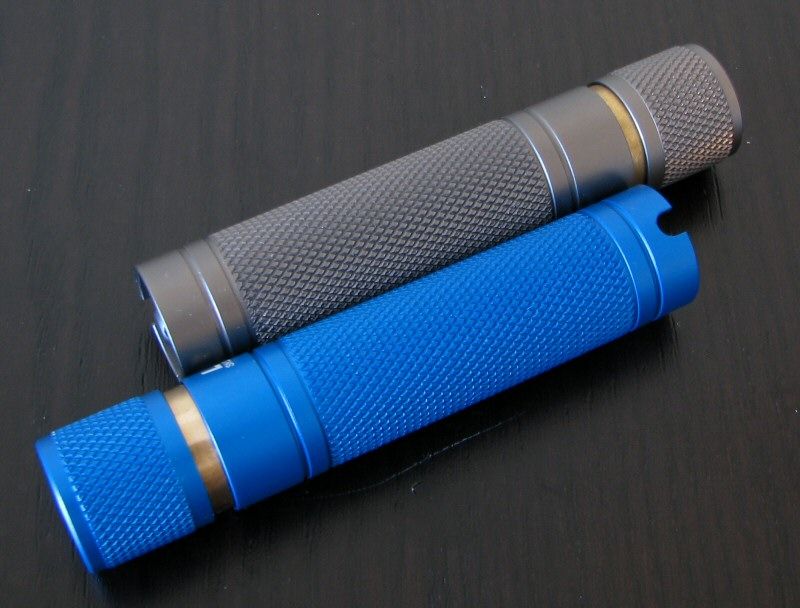
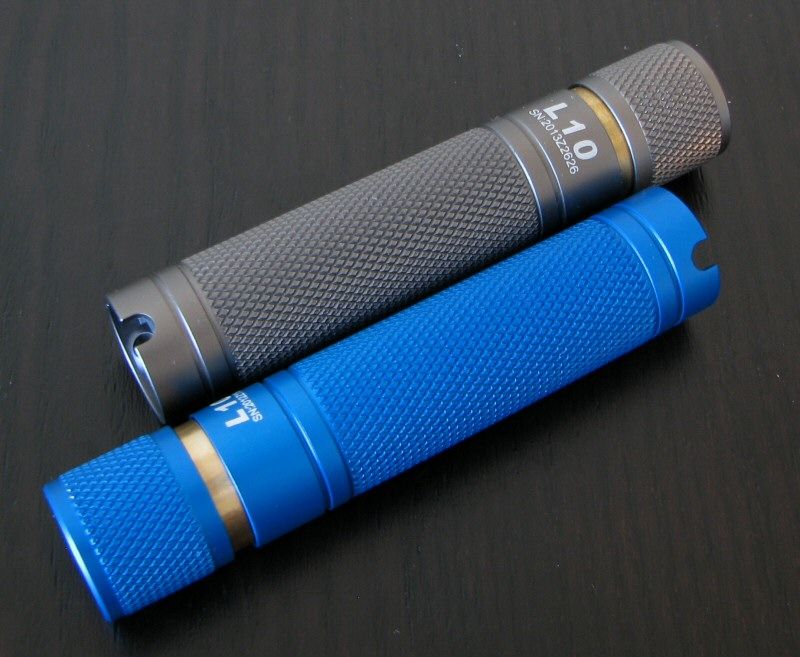
As you can see above, I have the full set of anodizing colors.
In addition to the two emitter types, half of the above samples are the 3-level version, and the other half are the 4-level model. This gives me a lot more data than usual to work with, so expect more detailed analyses of sample variation in this review.
Despite the use of two different emitters, L3 Illumination reports a common set of specifications. As you will see in my detailed testing later in this review, there are a few differences between the emitters.
Manufacturer Reported Specifications:
(note: as always, these are simply what the manufacturer provides – scroll down to see my actual testing results).
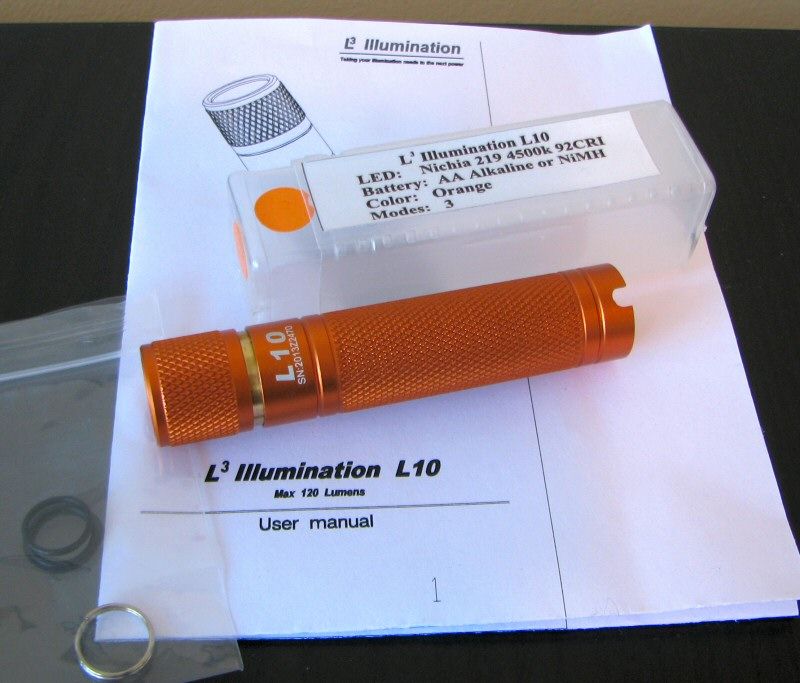
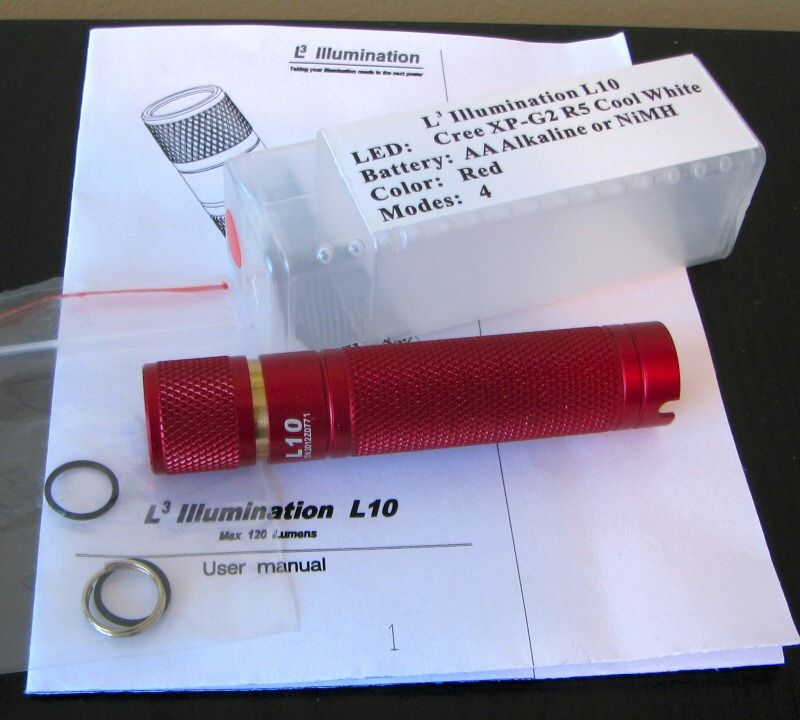
Packaging is pretty basic - a slightly opaque plastic "tube", which contains the light, extra o-rings and a small keychain ring. Printed on the outside of the container are the light specifics (including emitter type, color and mode number). I am not sure if the manual routinely comes with the lights – if not, you can download the PDF instruction manual from the dealer website (although the specs seem out of date in the manual – you are best to rely on the website for those).
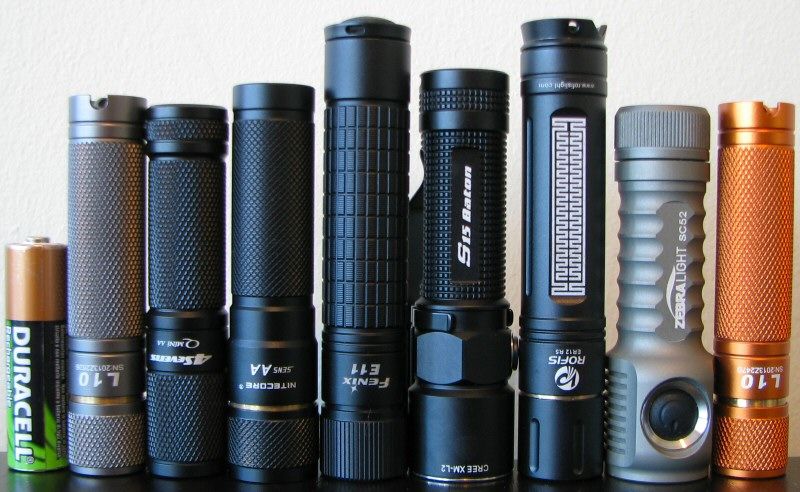
From left to right: Duracell NiMH AA; L3 Illumination L10; Foursevens Mini-AA; Nitecore SENS AA; Fenix E11; Olight S15; Rofis ER12; Zebralight SC52; L3 Illumination L10.
All dimensions directly measured, and given with no batteries installed:
L3 Illumination L10: Weight: 20.7g, Length: 79.4mm, Width (bezel): 17.1mm
ArmyTek A1 XP-G: Weight: 57.3g, Length: 96.8mm , Width (bezel): 23.1mm
Fenix LD12: Weight: 52.3g, Length: 99.9mm, Width (bezel): 21.6mm
Foursevens Mini AA: Weight: 17.6g, Length: 78.2mm, Width (bezel): 17.6mm
Olight S15 1xAA: Weight: 46.4g, Length: 87.0mm, Width (bezel): 23.1mm
Nitecore EA1: Weight: 50.6g, Length: 84.3mm, Width (bezel): 25.41mm
Nitecore MT1A: Weight: 54.6g, Length: 104.6mm, Width (bezel): 22.7mm
Nitecore SENS AA: Weight: 26.1g, Length: 82.7mm, Width (bezel): 19.8mm
Lumintop ED15: Weight: 59.7g, Length: 100.2, Width (bezel): 21.9mm
Zebralight SC52: Weight 39.5g, Length 79.0mm, Width (bezel): 22.6mm, Width (max) 25.4mm
Rofis ER12: Wright: 35.5g, Length: 96.2mm, Width (bezel): 18.6mm
Xeno E03:: Weight: 48.1g, Length 96.7mm, Width (bezel): 21.5mm
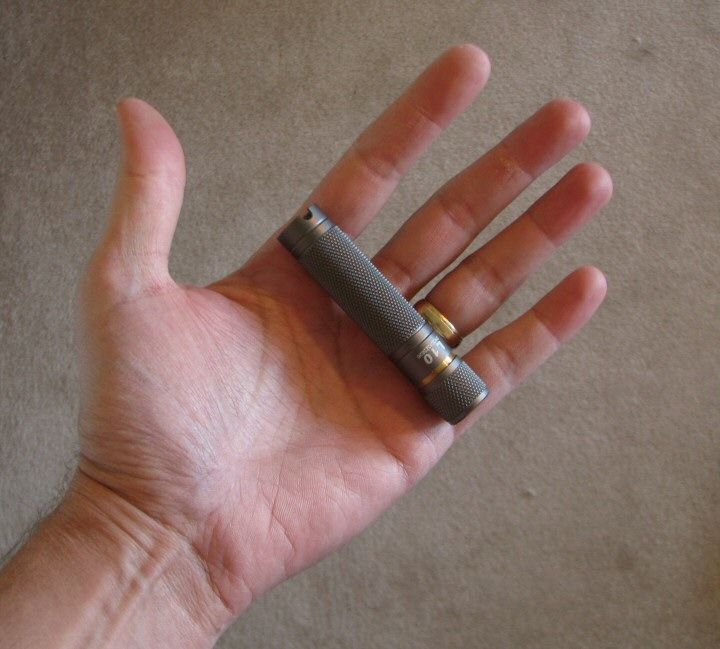
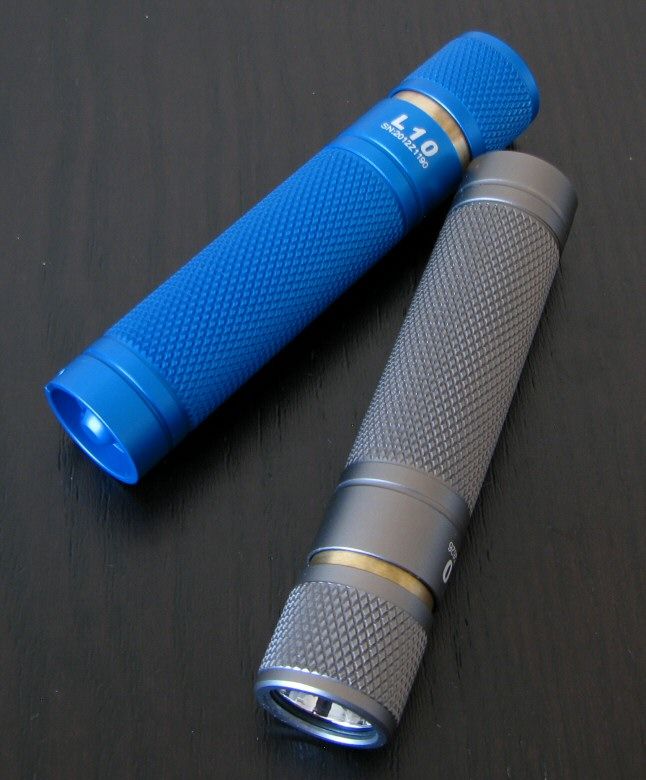
As you can see, the L10 is quite compact for a 1xAA light. This is consistent with its twisty interface.
The L10 series lights remind me of similar slim-lined offerings over the years from Nitecore, Foursevens, Thrunite, Lumintop and Olight/ITP. Overall construction is pretty basic, but serviceable for a keychain-style pocket light. Basically, you can think of these sorts of lights as the 1xAA equivalent of the common 1xAAA twisty lights from the above makers.
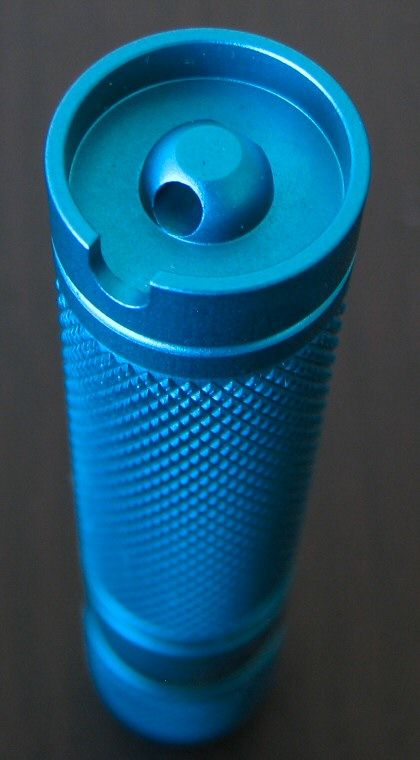
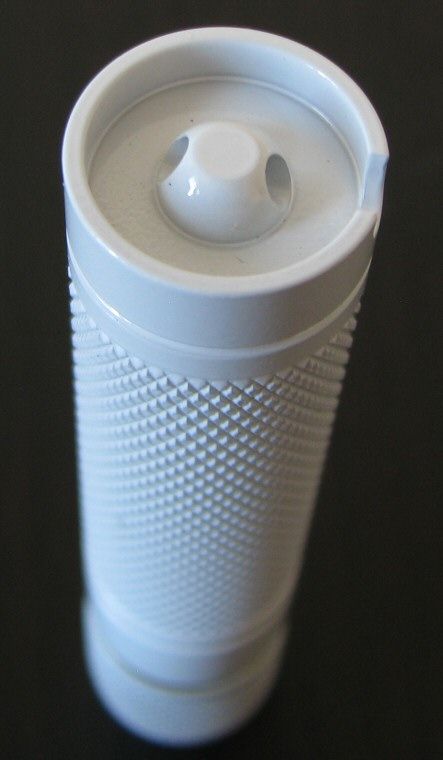
The L10 does have more knurling than most lights in this slim-lined class. While not overly aggressive (i.e., it won't shred clothing), it does help with grip. The various anodizing colors provide a range of options. The anodizing quality seems quite good on all colors, with no chips on any of my samples. Manufacturer claims hard anodized (aka, type III), which is better than most colored lights (which are only of type II strength). The one exception here is the white version, which is spray-painted over the grey-anodized form. This contributes to a more glossy finish and feel for the white version, and is more likely to chip than the other anodized colors.
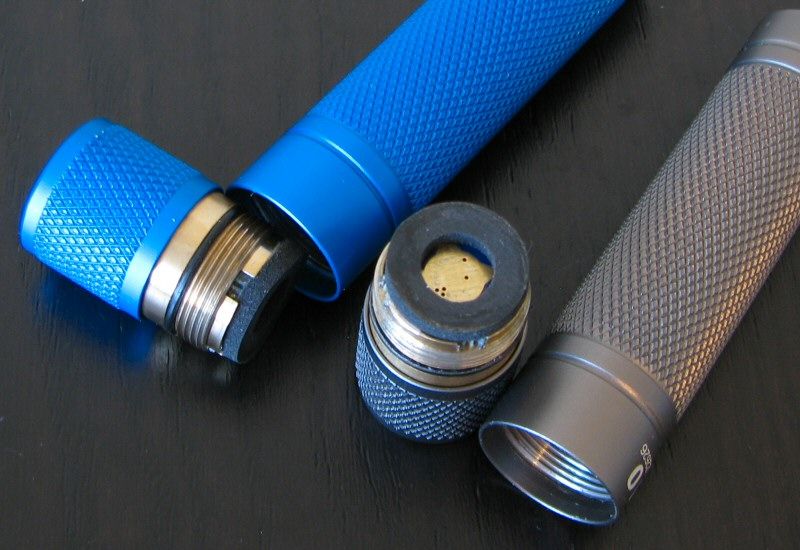
Screw threads are standard triangular cut, fairly fine (like most lights in this class). You can expect some play, but I found the fit to be reasonably good on my samples.
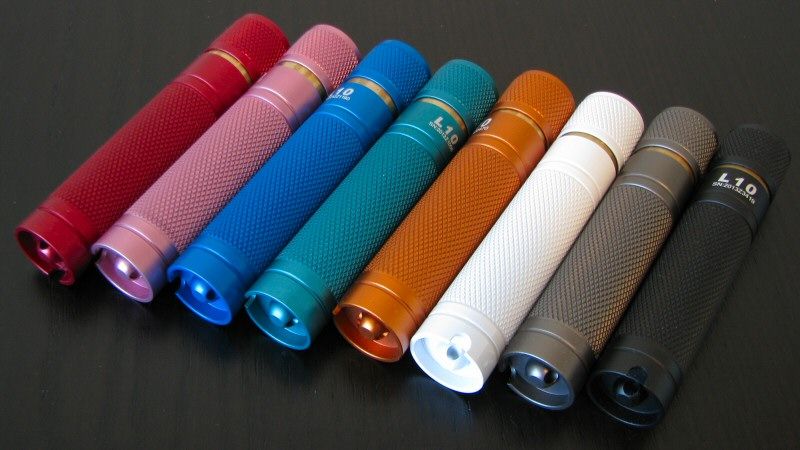
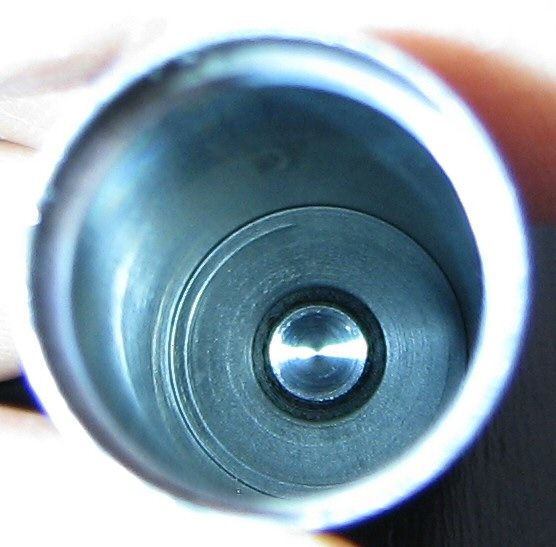
As you can see, the head of the L10 has a brass pill/base, like a number of lights in this slim-lined class (presumably for heat-sinking purposes). The battery contact surface in the head is flat, and includes a foam cushion surrounding the center disc. A cushion is common on these sorts of lights to reduce battery rattle, and to provide some extra padding. Note there is no spring in the tail region (only a small raised metal post). These types of lights thus all run the risk of crushing your cells if you over-tighten repeatedly.
There is a lanyard/spilt-ring attachment point at the base of the tailcap, with a cut-out for the keychain split-ring. As such, the lights can all tailstand stably.
As mentioned earlier, the lights are distinguished by their emitter choice:
Nichia 219
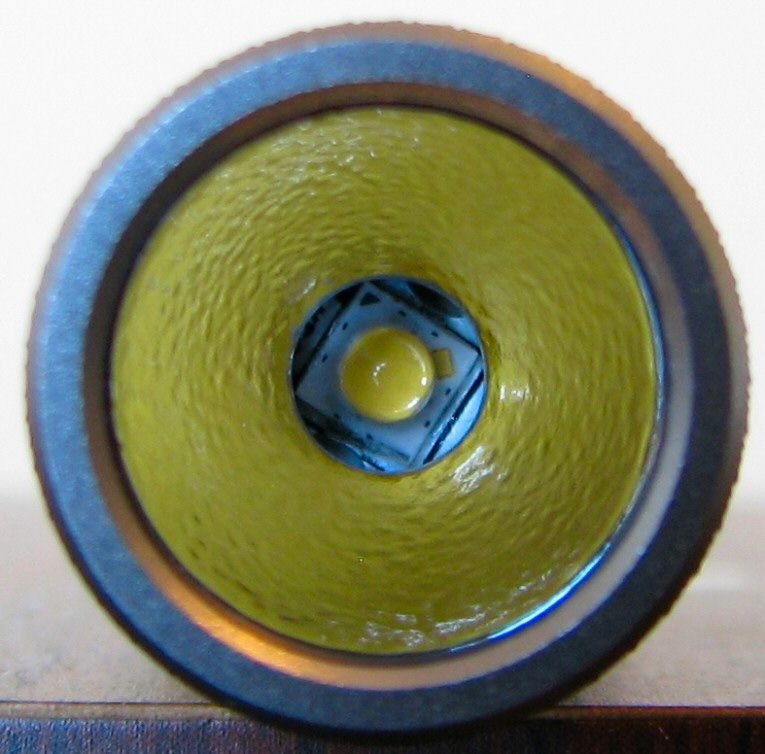
XP-G2 R5
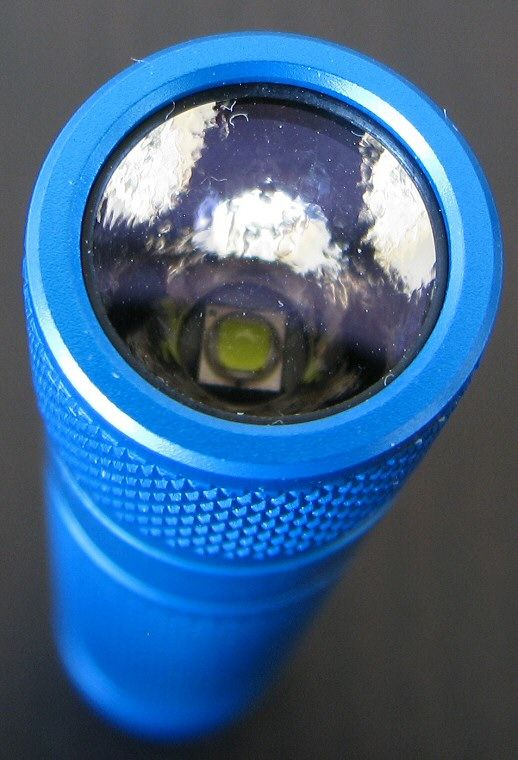
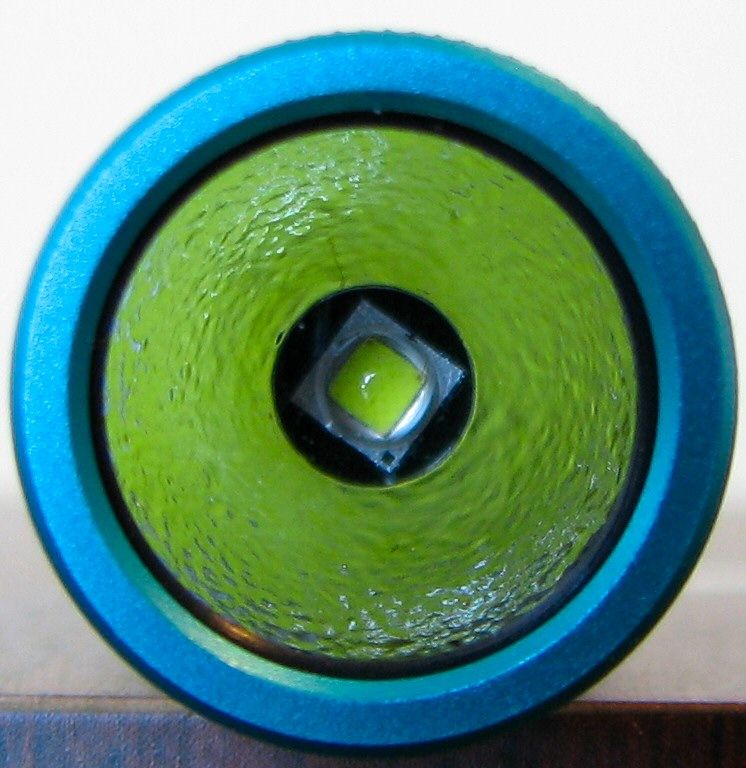
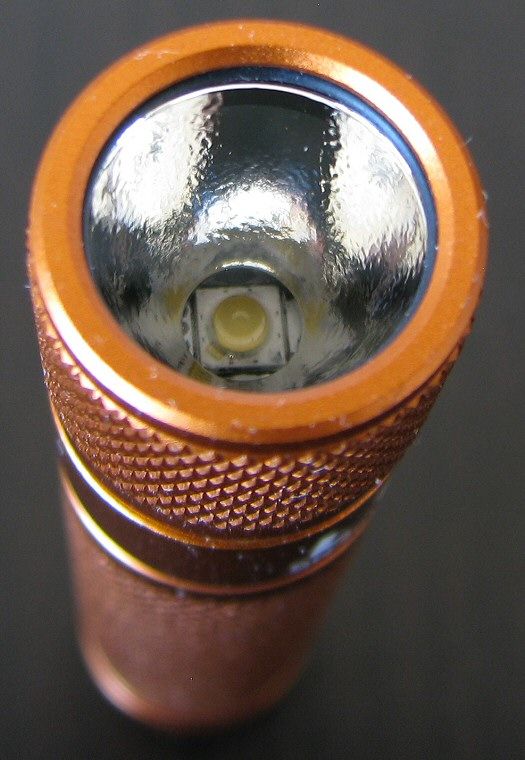
Centering was consistently good on my samples – there was only one in the whole group that was slightly off visibly, but not enough to affect the beam pattern. Both emitter versions seem to come with the same reflector – a relatively shallow one, with an orange peel (OP) coating to smooth out the beam.
Please see my detailed beamshots later in this review, for each model.
User Interface
The L10 uses the same interface as most AA/AAA-twisty lights.
Fully tighten the head and it comes on in its lowest mode (Firefly or Low, depending on the model). Do a rapid twist off-on and the light advances to next level. Mode sequence is Firefly > Lo > Med > Hi (or Lo > Med > Hi), in repeating sequence.
Turn the light off by loosening the head. There is no mode memory, and the light always defaults to its lowest setting if you wait more than a second or two before turning back on.
There is no strobe or SOS mode on the L10.
Video:
For information on the light, including the build and user interface, please see my video overview:
Video was recorded in 720p, but YouTube typically defaults to 360p. Once the video is running, you can click on the configuration settings icon and select the higher 480p to 720p options. You can also run full-screen.
As with all my videos, I recommend you have annotations turned on. I commonly update the commentary with additional information or clarifications before publicly releasing the video.
PWM
There is no sign of PWM at any output level, on any model. The L10 is current-controlled.
As mentioned above, there is no strobe or SOS mode on the L10.
Beamshots:
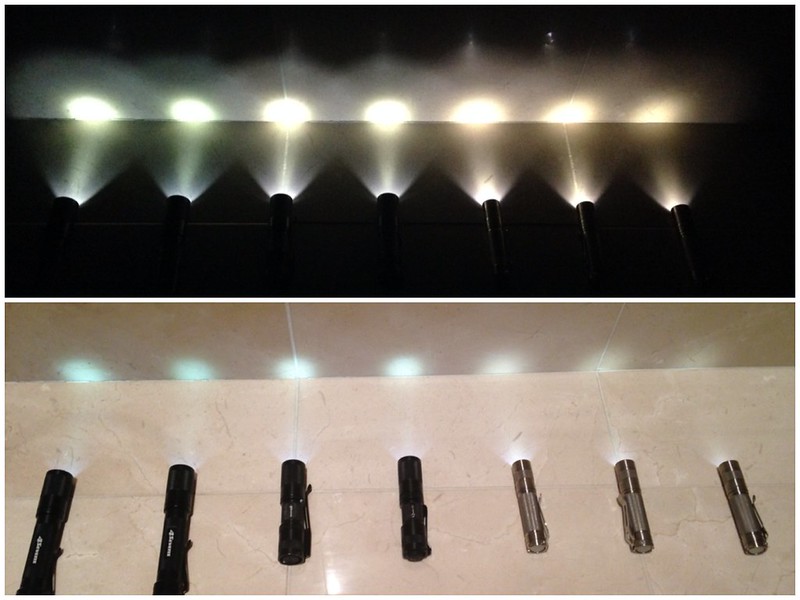
For white-wall beamshots below, all lights are on Max output on a Sanyo Eneloop NiMH (2000mAh). Lights are about ~0.75 meter from a white wall (with the camera ~1.25 meters back from the wall).
Automatic white balance on the camera, to minimize tint differences – except for the Nichia 219, which is using a Daylight white balance on my Canon camera.
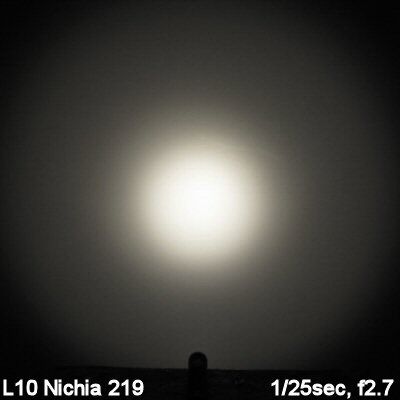
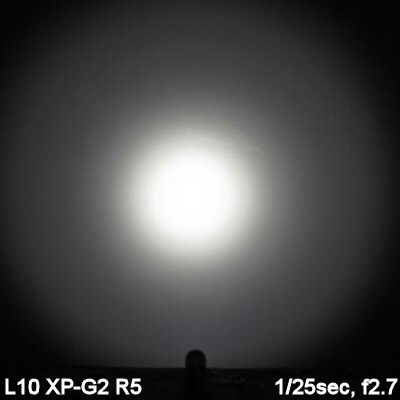
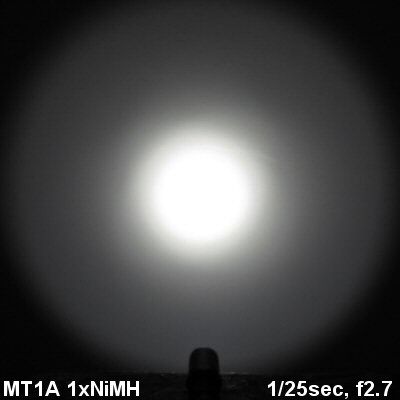
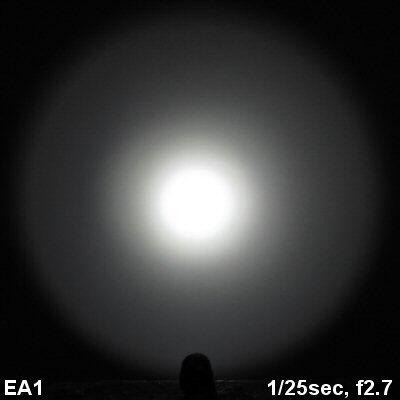

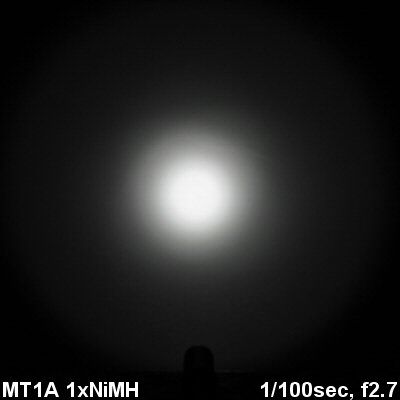
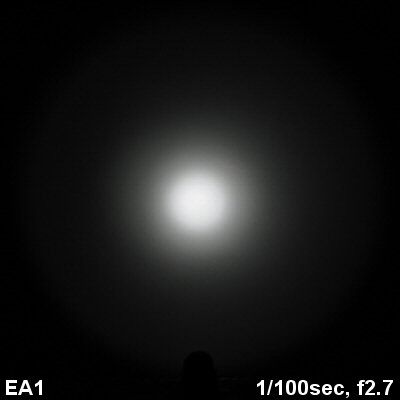
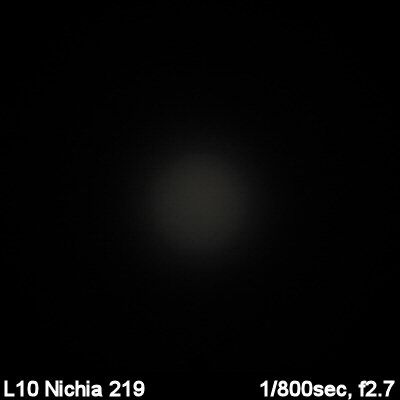
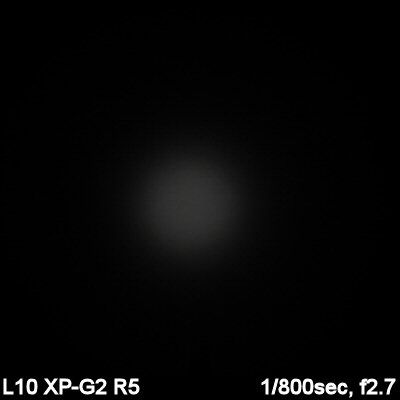


If you neglect beam tint (which is hard to capture on a camera, due to the narrow range of white balancing options), the overall beam pattern is not hugely different. I find the XP-G2 versions to be slightly more "throwy", with a more sharply defined hotspot and slightly greater throw.
But it is definitely the beam tint differences that you are likely to notice between these emitters. The 4500K on the Nichia is very pleasing (to my eye) neutral white. The higher color rendition index (CRI) should also help display colors more consistently.
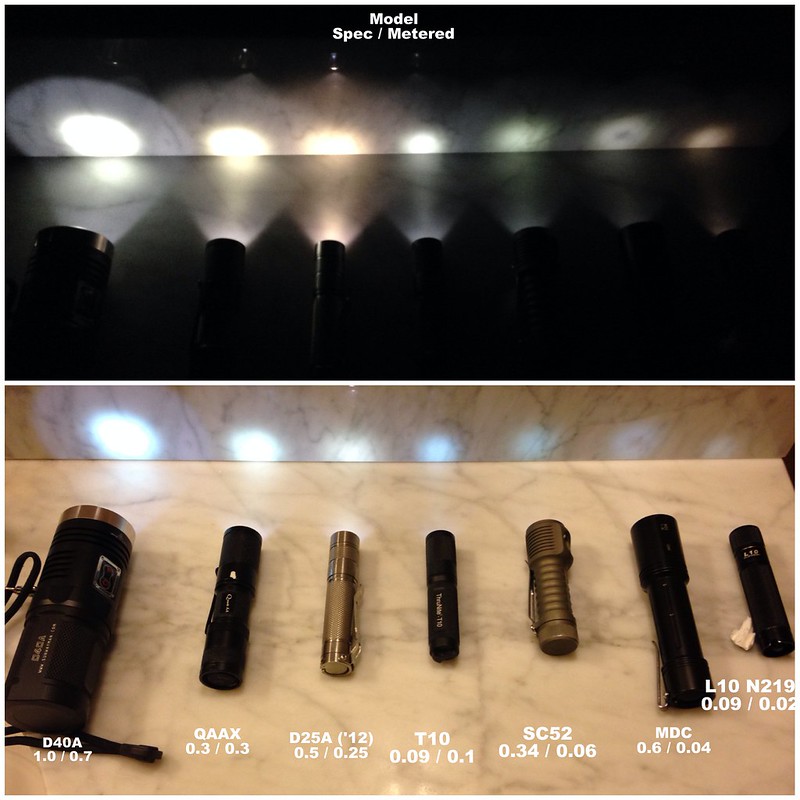
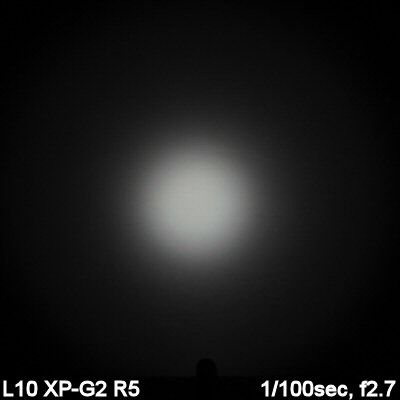
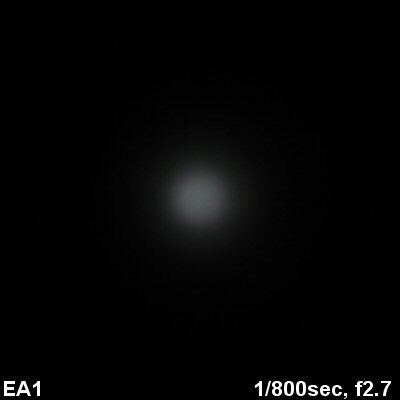
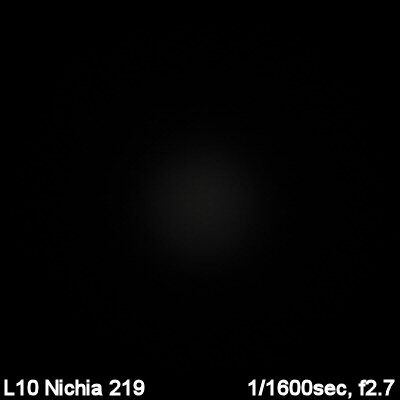
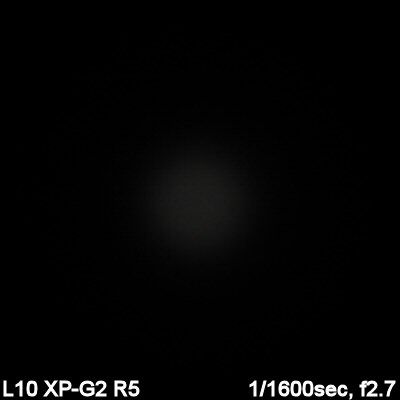
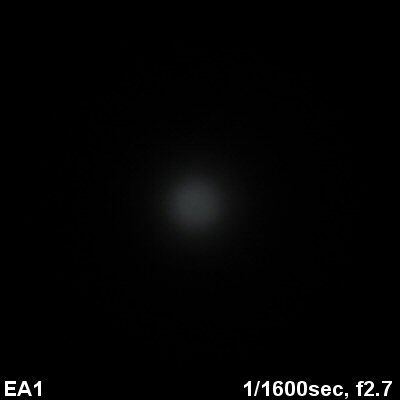
One question that comes up in a lot of my reviews is the consistency of <1 lumen Moonlight/Firefly modes. I have long argued that these are highly variable between samples of the same model (unlike >1 lumen levels, which are very consistent between samples). We have here an opportunity to start to test these differences, as all four of my 4-level models are rated as 0.09 lumens. How do they look? (Daylight white balance below)
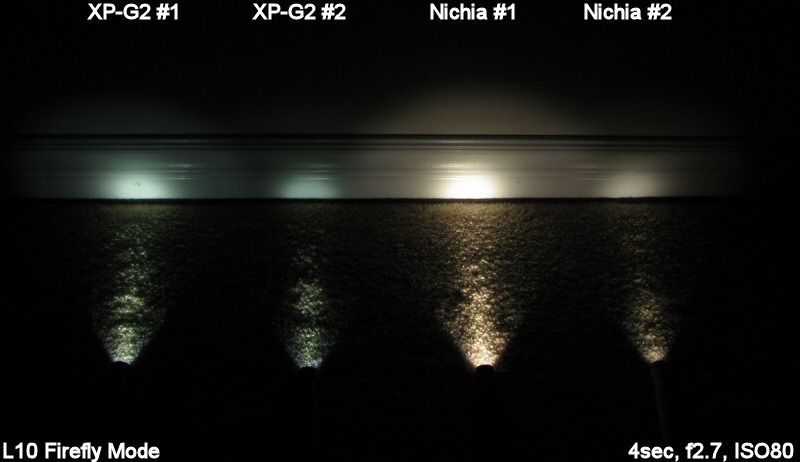
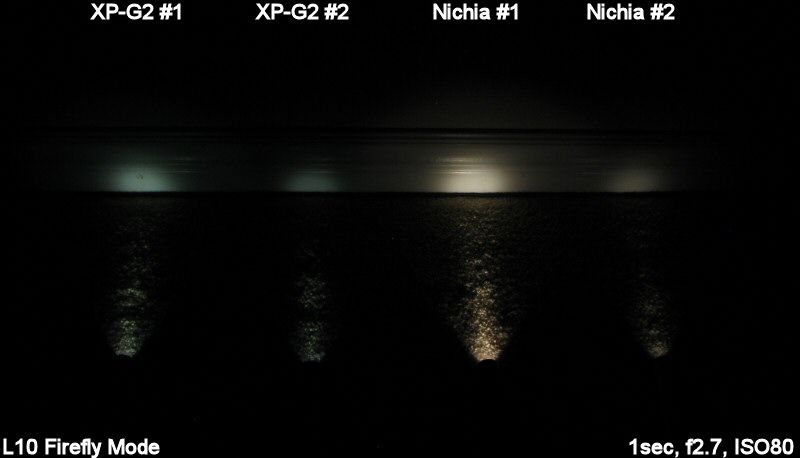
Clearly, there is a HUGE variability in the Firefly output levels among these samples – as I believe there are on all lights with <1 lumen modes.oo: As for the actual measured outputs (and sample variation measures), scroll down to my detailed testing.
Testing Method:
All my output numbers are relative for my home-made light box setup, as described on my flashlightreviews.ca website. You can directly compare all my relative output values from different reviews - i.e. an output value of "10" in one graph is the same as "10" in another. All runtimes are done under a cooling fan, except for any extended run Lo/Min modes (i.e. >12 hours) which are done without cooling.
I have devised a method for converting my lightbox relative output values (ROV) to estimated Lumens. See my How to convert Selfbuilt's Lightbox values to Lumens thread for more info.
My summary tables are reported in a manner consistent with the ANSI FL-1 standard for flashlight testing. Please see http://www.flashlightreviews.ca/FL1.htm for a discussion, and a description of all the terms used in these tables. Effective July 2012, I have updated all my Peak Intensity/Beam Distance measures with a NIST-certified Extech EA31 lightmeter (orange highlights).
--------
REVIEWER'S NOTE: Normally at this point I would provide a summary table showing how the output and throw of the review light compares to the competition. But we have a wonderful opportunity here to explore inter-sample variability, given that I have 8 samples of the L10 on hand (4 XP-G2s and 4 Nichia 219s, split into 3- and 4-mode versions). Let's work through what this means for us. :wave:
The first thing to note is that L3 Illumination reports identical output and runtime specs for the two emitter versions – although that's because both the XP-G2 R5 and Nichia 219 are still using the originally reported XP-G R5 specs. You might naturally question whether or not that is reasonable.
The best place to start to answer that question is to look at some output/runtime data. Below is a graph of the 8 lights (colored-grouped by emitter) on Hi, on Sanyo Eneloop:
The first thing you are likely to notice is that the XP-G2 versions (blue lines) all show higher output on max than the Nichia 219 versions (orange lines). The differences aren't huge, but it is suggestively consistent. The second thing to note is that the runtimes to 10% (ANSI FL-1 standard) don't seem appreciably different (although there is one Nichia that seems to be a bit of an outlier).
 It's always important to actually look at the data in this way, before rushing to do statistical comparisons. It's common in this hobby for people to want to reduce flashlights to just a couple of numbers (e.g., initial output and runtime). But it is often not valid to do that, due to all the differences in regulation and runtime patterns between different lights (see my website's methodology page for a good example of why you need to always look at the runtime data first). But in this case, the consistently tight regulation pattern on NiMH for all my L10 samples suggests we can proceed with some probabilistic statistical analyses.
In statistics, the standard measure used to describe how much variation there is from the average is known as the standard deviation (SD). You can easily calculate the SD and the average (mean), which gives you a convenient way to directly compare the variation between groups in a consistent manner. Simple sample statistics are commonly reported as the mean +/- the SD.
For a normally-distributed population (i.e., the class bell-shaped curve for IQ tests, and many naturally occurring phenomenon), you can think of the mean as the center of the curve, and a single standard deviation unit as being the point on either side of the mean where 68% of the samples would fall within. Let's see how the estimated lumens look:
What is shown above is the manufacturer's common lumen estimates for the four possible modes (first two columns). The next two columns are what I actually measured for each sample, broken down by emitter type (XP-G2 in column 3, Nichia 219 in column 4). These values are expressed as the mean +/- SD.
A few things jump out here (just looking at third and fourth columns for now). The first is that there is a lot of variability WITHIN the Firefly modes of a given group (although I caution here than the number of samples is lower). For either emitter, the Firefly SD is huge: ~80-95% of the mean value. This is consistent with what you saw in the beamshots earlier, for the four samples. In contrast, the Lo/Med/Hi modes show a far more consistent ~3-10% SD variance around the mean, on either emitter.
The second major finding is that the absolute mean for each emitter group is not that different (at any level). The possible exception to this is the Hi mode, where there does seem to be a more consistent difference (as we saw in the earlier graph). Is this measurably significant?
To address that issue, I have performed a very common statistical hypothesis test known as the Student's t test (or simply, the t-test). This test is used to determine if two sets of data are statistically significantly different from each other. It is common to use the probability statistic p < 0.05 as a cut-off for statistical significance. P-values are often misunderstood as the given odds ratio of being right (i.e., a lot of people erroneously think that p = 0.05 means there is a one in twenty chance of being wrong). In fact, when used in this context to compare samples of larger populations, p = 0.05 actually means that only 1 time out of 20 would you expect to see a difference this great between two groups of samples when in fact there wasn't one.
Doing multiple t-tests within a larger data set is a statistical no-no, but I feel quite confident in doing the four limited comparisons shown in column 5 above (i.e., are the two emitter groups different for each level, at the p < 0.05 cut-off level?). If you are curious, there are correction methods for much larger multiple comparisons (e.g. Bonferroni), but these tend be overly conservative and not necessary in our limited example. As an aside, most fields of science would use an analysis of variance (ANOVA) F-test for these types of comparisons, followed by a post-hoc test. What many (even in the science biz) don't realize is that the various post-hoc tests all suffer from similar correction factor shenanigans as the simpler t-test methods. Statistical purists decry all post-hoc analyses.
Back on topic: the t-test results tell us that we can reasonably believe that the Hi mode of the XP-G2 and Nichia 219 sub-groups are in fact different from one another. This is consistent with we observed on the output/runtime graph above – there seems to be a difference between these two groups.
The t-tests also tell us that there is no apparent difference between the two emitter groups at any of the other levels (i.e., Firefly/Lo/Med). As a result, there is no real justification for treating them separately in this analysis – I have combined all the samples into one joint column (column 6) for these levels.
Long story short: You can use the bolded numbers in the table above as the best measures of the true mean and variance for each level. Only in the case of the Hi mode do you need to consider these separately, by emitter type.
All that being said, is the absolute difference between the Hi outputs of the XP-G2 and Nichia 219s all that different? Not really - you are looking at a <10% typical difference. The visual differences in beam profile and tint between these emitters will be far more noticeable than such minor overall output differences.
So much for output then. How about runtime? For this, I've only done ANSI FL-1 standard testing (i.e., time to 10%) on the Hi mode on Sanyo Eneloop:
Again, you can see the stats back up what you could see in the output/runtime graph (leaving all the data in). That is, there is no significant different in runtime on Hi between these two emitter classes. I would recommend you stick with the combined column measure above.
It is nice to see that both the lumen and runtime specs provided by L3 Illumination seem to match very well with my testing. It's also nice to see that there is relatively little variation between samples – these sorts of standard deviations (at these n levels) are quite good.
Given the much larger difference in beam profile between these emitters, how does the throw compare?
Ding-ding-ding, we have a winner! There is remarkably little variation in peak intensity throw WITHIN each emitter group – but a noticeable difference BETWEEN emitter groups. In common statistical parlance, the actual p value here would typically be described as "highly statistically significant" (i.e., well below p < 0.01).
So, while there is a small increase in max output with the XP-G2 version (<10%), there is a much more noticeable increase in peak intensity throw (>35%). But before you get too carried away, keep in mind that a better way to meaningfully compare throw is by beam distance to a common intensity (not raw intensity at a common distance). By the common ANSI FL-1 beam distance measure, the XP-G2s are only a little >15% further throwing than the Nichia 219s (recall: light decays with distance by an inverse square law).
Now let's roll all that up into my usual simple summary table for NiMH, broken down by emitter group for the L10 (given the statistically significant differences on Hi). Since there is no statistical reason to separate the lights by emitter on Firefly/Lo, I've left those fields common.
You'll note above that ceiling bounce numbers (which I provide as an additional output measure) suggest a greater output difference between the emitter types on Hi. I suspect this is due to the more throwy beam on the XP-G2 model (i.e., throwy beams tend to get higher ceiling bounce numbers, likely due to direct reflectance off the ceiling back to the sensor). As always, I recommend you go with the much better calibrated lightbox numbers.
For 1x14500 (3.7V Li-ion), the manufacturer recommends you don't run the light on this source, due to rapid heat buildup. In case you were wondering, here is a comparison table of estimated lumen outputs:
As you can see, all modes of the lights are much brighter on 14500. I have broken the Med/Hi results up by emitter on 14500, as t-tests suggest these are significantly different (no difference between emitters detected on Firefly or Lo). On the basis of these results, I also recommend you don't run the lights on Med or Hi on 14500, as the output considerably exceeds the Hi level of standard cells. You may thus damage the emitter or battery by the heat buildup (i.e., there is little thermal mass to help cool the light).
Another other thing to notice above is that the sub-lumen Firefly mode is actually maintained, although it is about four times brighter on 14500 (on average). Interesting, the variability measure stays about the same, which goes to show you that consistency between moonlight/firefly levels improves at the higher levels (i.e., the lower the moonlight level, the more relative variation you are likely to see).
One last comment about the above - don't get caught up on the implied precision of the lumen estimates. I provide 3 significant figures (sig figs, or sig digs/significant digits as the kids call them today) in that table abpve so that you can get a better feel of variability. I personally limit most of my tables to 2 sig figs, because I don't believe you should be inferring accuracy to the precision of my instumentation (i.e., just because I can measure my lumen estimates consistently doesn't mean it represents the "true" lumen value).
-----
Ok, that was a lot of data. :sweat: I know that was a long preamble to get to this point, but hopefully those of you who are more quantitatively-inclined will have appreciated it. :wave:
Runtimes
For comparison output/runtimes, I've picked a "representational" sample of each emitter group. In other words, I've picked a sample for each group that was relatively near the mean for that group (for both runtime and output).
Performance is pretty much what you would expect for a good XP-G/XP-G2 light – excellent regulation, and typical runtime for current-control.
Since the manufacturer recommends against running the lights on 14500, I have not done additional runtimes on this battery source.
Potential Issues
Lights roll easily.
Although impressively small for 1xAA lights, the L10s may still be a bit large for a keychain light.
Twisty lights that tighten to activate or change modes always have the potential to be battery crushers. Care needs to be used not to over-tighten, especially when mode switching.
Like with other lights in this slim-lined class, output levels are much higher on 14500 (3.7V Li-ion). The manufacturer recommends against running the lights this way (due to heat buildup), and I concur. I recommend you do not run these lights on Med or Hi on 14500 – best to limit yourself to Firefly/Lo modes (which are much brighter than on standard cells).
Preliminary Observations
The L10 by L3 Illumination is a nice slim-lined 1xAA light, very similar in functionality to a number of competing lights by Olight/ITP, Foursevens, Fenix, Thrunite and others. What really distinguishes the L10 is the stock option of the latest Cree emitter (XP-G2 cool white), or the popular Hi CRI Nichia 219 neutral white emitter. Decisions, decisions.
One nice feature is the use of current-control for the low modes on the L10. Although this is becoming increasing common, some of the earlier slim-lined designs from other makers used PWM (with potentially visible flicker). My L10 samples were all fully flat-regulated and visually stable on all levels, including Firefly.
Another difference here is that you have the option of a 3-level (Lo/Med/Hi) or 4-level (Firefly/Lo/Med/Hi) model. The only difference is the addition of the extra Firefly level at the start of the mode sequence. Note there is no mode memory, and the lights all start at their lowest level. Mode spacing seems good to me (and I personally like the dim Firefly mode).
Finally, you have the option of a range of anodized colors. Many lights remind me of the famous quote from Henry Ford - "any customer can have a car painted any colour that he wants so long as it is black." The colors here are all reported as hard anodized (aka type III), and I certainly saw no signs of chips or damage on any of the ones I've handled. Body design is good for this class, with better grip than some (i.e., can easily use one-handed).
The manufacturer doesn't recommend the use of 14500 Li-ion batteries (because of the high heat, due to the much higher output). I concur, and recommend you stick with standard AA cells (NiMH, alkaline or L91 lithium). Performance-wise, the current-controlled circuit worked consistently well in my testing. Runtimes are excellent for the class, and regulation was relatively flat.
Beam pattern is quite good on both emitter types, a fairly general purpose beam. I personally prefer the slightly smoother hotspot-to-spill transitions of the Nichia 219 – not to mention its neutral white tint and higher CRI. But that choice is yours.
As an aside, it was nice to be able to do some detailed sample variation testing on the L10. I don't get that opportunity very often, and the results here match my previous experience. To wit, Firefly/Moonlight mode output levels can be extremely variable between samples of the same model, but most regular modes are very consistent. In my experience, this significant variability is true of all lights with <1 lumen modes (particularly <0.1 lumen modes), which is why you see so many disagreements here about the actual lumen level of various people's n=1 samples. Note that I didn't directly test runtimes at the low levels on the L10, but I have previously had the same experience on that front as well (i.e., runtimes are generally very consistent at higher outputs, and very variable at low ones).
A nice addition to the simple, twisty-style class of 1xAA lights. Not much to criticize here, it seems like L3 Illumination has gotten this model right.
----
L3 Illumination L10 lights were supplied by sbflashlights.com for review.
This is a review of the 1xAA L3 Illumination L10 – available with either a XP-G2 R5 (Cool White) or the Nichia 219 4500K 92CRI (Neutral White).
As you can see above, I have the full set of anodizing colors.
In addition to the two emitter types, half of the above samples are the 3-level version, and the other half are the 4-level model. This gives me a lot more data than usual to work with, so expect more detailed analyses of sample variation in this review.
Despite the use of two different emitters, L3 Illumination reports a common set of specifications. As you will see in my detailed testing later in this review, there are a few differences between the emitters.
Manufacturer Reported Specifications:
(note: as always, these are simply what the manufacturer provides – scroll down to see my actual testing results).
- LED: Cree XP-G2 R5 Cool White or Nichia 219 4500K 92CRI B10 bin
- Note: these specs are apparently based on the earlier XP-G R5 model. The dealer's website suggest the XP-G2 outputs will be higher, but doesn't provide details
- Four modes of output: firefly (0.09lumens, 147hours) -> Low (3 lumens, 30hrs) -> Medium (30 lumens) --> High (120 lumens, 1.5hrs) -> (Tested with Ni-mh battery with actual capacity 2500mAh)
- Note: 3 mode model removes Firefly mode of 0.09 lumens. Low, Medium, High only
- Stable current regulated circuit, stable brightness
- Uses one 1.5V AA battery (ni-mh, alkaline ). 14500 batteries are not recommeded, because they heat up quickly.
- 20-gram weight (excluding batteries)
- Made of durable aircraft-grade aluminum
- Premium Type III hard-anodized anti-abrasive finish
- Waterproof to IPX-8 Standard
- Toughened double ultra-clear glass lens
- Reliable twist switch
- Candle mode (Capable of standing up securely on a flat surface to serve as a candle)
- Size: 79mm(length)x17.1mm(dia)
- Mode switch: Tighten and loosen the head to switch between modes.
- No mode memory, always starts on Firefly mode
- MSRP: ~$23-25
Packaging is pretty basic - a slightly opaque plastic "tube", which contains the light, extra o-rings and a small keychain ring. Printed on the outside of the container are the light specifics (including emitter type, color and mode number). I am not sure if the manual routinely comes with the lights – if not, you can download the PDF instruction manual from the dealer website (although the specs seem out of date in the manual – you are best to rely on the website for those).
From left to right: Duracell NiMH AA; L3 Illumination L10; Foursevens Mini-AA; Nitecore SENS AA; Fenix E11; Olight S15; Rofis ER12; Zebralight SC52; L3 Illumination L10.
All dimensions directly measured, and given with no batteries installed:
L3 Illumination L10: Weight: 20.7g, Length: 79.4mm, Width (bezel): 17.1mm
ArmyTek A1 XP-G: Weight: 57.3g, Length: 96.8mm , Width (bezel): 23.1mm
Fenix LD12: Weight: 52.3g, Length: 99.9mm, Width (bezel): 21.6mm
Foursevens Mini AA: Weight: 17.6g, Length: 78.2mm, Width (bezel): 17.6mm
Olight S15 1xAA: Weight: 46.4g, Length: 87.0mm, Width (bezel): 23.1mm
Nitecore EA1: Weight: 50.6g, Length: 84.3mm, Width (bezel): 25.41mm
Nitecore MT1A: Weight: 54.6g, Length: 104.6mm, Width (bezel): 22.7mm
Nitecore SENS AA: Weight: 26.1g, Length: 82.7mm, Width (bezel): 19.8mm
Lumintop ED15: Weight: 59.7g, Length: 100.2, Width (bezel): 21.9mm
Zebralight SC52: Weight 39.5g, Length 79.0mm, Width (bezel): 22.6mm, Width (max) 25.4mm
Rofis ER12: Wright: 35.5g, Length: 96.2mm, Width (bezel): 18.6mm
Xeno E03:: Weight: 48.1g, Length 96.7mm, Width (bezel): 21.5mm
As you can see, the L10 is quite compact for a 1xAA light. This is consistent with its twisty interface.
The L10 series lights remind me of similar slim-lined offerings over the years from Nitecore, Foursevens, Thrunite, Lumintop and Olight/ITP. Overall construction is pretty basic, but serviceable for a keychain-style pocket light. Basically, you can think of these sorts of lights as the 1xAA equivalent of the common 1xAAA twisty lights from the above makers.
The L10 does have more knurling than most lights in this slim-lined class. While not overly aggressive (i.e., it won't shred clothing), it does help with grip. The various anodizing colors provide a range of options. The anodizing quality seems quite good on all colors, with no chips on any of my samples. Manufacturer claims hard anodized (aka, type III), which is better than most colored lights (which are only of type II strength). The one exception here is the white version, which is spray-painted over the grey-anodized form. This contributes to a more glossy finish and feel for the white version, and is more likely to chip than the other anodized colors.
Screw threads are standard triangular cut, fairly fine (like most lights in this class). You can expect some play, but I found the fit to be reasonably good on my samples.
As you can see, the head of the L10 has a brass pill/base, like a number of lights in this slim-lined class (presumably for heat-sinking purposes). The battery contact surface in the head is flat, and includes a foam cushion surrounding the center disc. A cushion is common on these sorts of lights to reduce battery rattle, and to provide some extra padding. Note there is no spring in the tail region (only a small raised metal post). These types of lights thus all run the risk of crushing your cells if you over-tighten repeatedly.
There is a lanyard/spilt-ring attachment point at the base of the tailcap, with a cut-out for the keychain split-ring. As such, the lights can all tailstand stably.
As mentioned earlier, the lights are distinguished by their emitter choice:
Nichia 219
XP-G2 R5
Centering was consistently good on my samples – there was only one in the whole group that was slightly off visibly, but not enough to affect the beam pattern. Both emitter versions seem to come with the same reflector – a relatively shallow one, with an orange peel (OP) coating to smooth out the beam.
Please see my detailed beamshots later in this review, for each model.
User Interface
The L10 uses the same interface as most AA/AAA-twisty lights.
Fully tighten the head and it comes on in its lowest mode (Firefly or Low, depending on the model). Do a rapid twist off-on and the light advances to next level. Mode sequence is Firefly > Lo > Med > Hi (or Lo > Med > Hi), in repeating sequence.
Turn the light off by loosening the head. There is no mode memory, and the light always defaults to its lowest setting if you wait more than a second or two before turning back on.
There is no strobe or SOS mode on the L10.
Video:
For information on the light, including the build and user interface, please see my video overview:
Video was recorded in 720p, but YouTube typically defaults to 360p. Once the video is running, you can click on the configuration settings icon and select the higher 480p to 720p options. You can also run full-screen.
As with all my videos, I recommend you have annotations turned on. I commonly update the commentary with additional information or clarifications before publicly releasing the video.
PWM
There is no sign of PWM at any output level, on any model. The L10 is current-controlled.
As mentioned above, there is no strobe or SOS mode on the L10.
Beamshots:
For white-wall beamshots below, all lights are on Max output on a Sanyo Eneloop NiMH (2000mAh). Lights are about ~0.75 meter from a white wall (with the camera ~1.25 meters back from the wall).
Automatic white balance on the camera, to minimize tint differences – except for the Nichia 219, which is using a Daylight white balance on my Canon camera.
If you neglect beam tint (which is hard to capture on a camera, due to the narrow range of white balancing options), the overall beam pattern is not hugely different. I find the XP-G2 versions to be slightly more "throwy", with a more sharply defined hotspot and slightly greater throw.
But it is definitely the beam tint differences that you are likely to notice between these emitters. The 4500K on the Nichia is very pleasing (to my eye) neutral white. The higher color rendition index (CRI) should also help display colors more consistently.
One question that comes up in a lot of my reviews is the consistency of <1 lumen Moonlight/Firefly modes. I have long argued that these are highly variable between samples of the same model (unlike >1 lumen levels, which are very consistent between samples). We have here an opportunity to start to test these differences, as all four of my 4-level models are rated as 0.09 lumens. How do they look? (Daylight white balance below)
Clearly, there is a HUGE variability in the Firefly output levels among these samples – as I believe there are on all lights with <1 lumen modes.
oo: As for the actual measured outputs (and sample variation measures), scroll down to my detailed testing.Testing Method:
All my output numbers are relative for my home-made light box setup, as described on my flashlightreviews.ca website. You can directly compare all my relative output values from different reviews - i.e. an output value of "10" in one graph is the same as "10" in another. All runtimes are done under a cooling fan, except for any extended run Lo/Min modes (i.e. >12 hours) which are done without cooling.
I have devised a method for converting my lightbox relative output values (ROV) to estimated Lumens. See my How to convert Selfbuilt's Lightbox values to Lumens thread for more info.
My summary tables are reported in a manner consistent with the ANSI FL-1 standard for flashlight testing. Please see http://www.flashlightreviews.ca/FL1.htm for a discussion, and a description of all the terms used in these tables. Effective July 2012, I have updated all my Peak Intensity/Beam Distance measures with a NIST-certified Extech EA31 lightmeter (orange highlights).
--------
REVIEWER'S NOTE: Normally at this point I would provide a summary table showing how the output and throw of the review light compares to the competition. But we have a wonderful opportunity here to explore inter-sample variability, given that I have 8 samples of the L10 on hand (4 XP-G2s and 4 Nichia 219s, split into 3- and 4-mode versions). Let's work through what this means for us. :wave:
The first thing to note is that L3 Illumination reports identical output and runtime specs for the two emitter versions – although that's because both the XP-G2 R5 and Nichia 219 are still using the originally reported XP-G R5 specs. You might naturally question whether or not that is reasonable.
The best place to start to answer that question is to look at some output/runtime data. Below is a graph of the 8 lights (colored-grouped by emitter) on Hi, on Sanyo Eneloop:
The first thing you are likely to notice is that the XP-G2 versions (blue lines) all show higher output on max than the Nichia 219 versions (orange lines). The differences aren't huge, but it is suggestively consistent. The second thing to note is that the runtimes to 10% (ANSI FL-1 standard) don't seem appreciably different (although there is one Nichia that seems to be a bit of an outlier).
It's always important to actually look at the data in this way, before rushing to do statistical comparisons. It's common in this hobby for people to want to reduce flashlights to just a couple of numbers (e.g., initial output and runtime). But it is often not valid to do that, due to all the differences in regulation and runtime patterns between different lights (see my website's methodology page for a good example of why you need to always look at the runtime data first). But in this case, the consistently tight regulation pattern on NiMH for all my L10 samples suggests we can proceed with some probabilistic statistical analyses. In statistics, the standard measure used to describe how much variation there is from the average is known as the standard deviation (SD). You can easily calculate the SD and the average (mean), which gives you a convenient way to directly compare the variation between groups in a consistent manner. Simple sample statistics are commonly reported as the mean +/- the SD.
For a normally-distributed population (i.e., the class bell-shaped curve for IQ tests, and many naturally occurring phenomenon), you can think of the mean as the center of the curve, and a single standard deviation unit as being the point on either side of the mean where 68% of the samples would fall within. Let's see how the estimated lumens look:
What is shown above is the manufacturer's common lumen estimates for the four possible modes (first two columns). The next two columns are what I actually measured for each sample, broken down by emitter type (XP-G2 in column 3, Nichia 219 in column 4). These values are expressed as the mean +/- SD.
A few things jump out here (just looking at third and fourth columns for now). The first is that there is a lot of variability WITHIN the Firefly modes of a given group (although I caution here than the number of samples
is lower). For either emitter, the Firefly SD is huge: ~80-95% of the mean value. This is consistent with what you saw in the beamshots earlier, for the four samples. In contrast, the Lo/Med/Hi modes show a far more consistent ~3-10% SD variance around the mean, on either emitter.The second major finding is that the absolute mean for each emitter group is not that different (at any level). The possible exception to this is the Hi mode, where there does seem to be a more consistent difference (as we saw in the earlier graph). Is this measurably significant?
To address that issue, I have performed a very common statistical hypothesis test known as the Student's t test (or simply, the t-test). This test is used to determine if two sets of data are statistically significantly different from each other. It is common to use the probability statistic p < 0.05 as a cut-off for statistical significance. P-values are often misunderstood as the given odds ratio of being right (i.e., a lot of people erroneously think that p = 0.05 means there is a one in twenty chance of being wrong). In fact, when used in this context to compare samples of larger populations, p = 0.05 actually means that only 1 time out of 20 would you expect to see a difference this great between two groups of samples when in fact there wasn't one.
Doing multiple t-tests within a larger data set is a statistical no-no, but I feel quite confident in doing the four limited comparisons shown in column 5 above (i.e., are the two emitter groups different for each level, at the p < 0.05 cut-off level?). If you are curious, there are correction methods for much larger multiple comparisons (e.g. Bonferroni), but these tend be overly conservative and not necessary in our limited example. As an aside, most fields of science would use an analysis of variance (ANOVA) F-test for these types of comparisons, followed by a post-hoc test. What many (even in the science biz) don't realize is that the various post-hoc tests all suffer from similar correction factor shenanigans as the simpler t-test methods. Statistical purists decry all post-hoc analyses.
Back on topic: the t-test results tell us that we can reasonably believe that the Hi mode of the XP-G2 and Nichia 219 sub-groups are in fact different from one another. This is consistent with we observed on the output/runtime graph above – there seems to be a difference between these two groups.
The t-tests also tell us that there is no apparent difference between the two emitter groups at any of the other levels (i.e., Firefly/Lo/Med). As a result, there is no real justification for treating them separately in this analysis – I have combined all the samples into one joint column (column 6) for these levels.
Long story short: You can use the bolded numbers in the table above as the best measures of the true mean and variance for each level. Only in the case of the Hi mode do you need to consider these separately, by emitter type.
All that being said, is the absolute difference between the Hi outputs of the XP-G2 and Nichia 219s all that different? Not really - you are looking at a <10% typical difference. The visual differences in beam profile and tint between these emitters will be far more noticeable than such minor overall output differences.
So much for output then. How about runtime? For this, I've only done ANSI FL-1 standard testing (i.e., time to 10%) on the Hi mode on Sanyo Eneloop:
Again, you can see the stats back up what you could see in the output/runtime graph (leaving all the data in). That is, there is no significant different in runtime on Hi between these two emitter classes. I would recommend you stick with the combined column measure above.
It is nice to see that both the lumen and runtime specs provided by L3 Illumination seem to match very well with my testing. It's also nice to see that there is relatively little variation between samples – these sorts of standard deviations (at these n levels) are quite good.
Given the much larger difference in beam profile between these emitters, how does the throw compare?
Ding-ding-ding, we have a winner!
There is remarkably little variation in peak intensity throw WITHIN each emitter group – but a noticeable difference BETWEEN emitter groups. In common statistical parlance, the actual p value here would typically be described as "highly statistically significant" (i.e., well below p < 0.01). So, while there is a small increase in max output with the XP-G2 version (<10%), there is a much more noticeable increase in peak intensity throw (>35%). But before you get too carried away, keep in mind that a better way to meaningfully compare throw is by beam distance to a common intensity (not raw intensity at a common distance). By the common ANSI FL-1 beam distance measure, the XP-G2s are only a little >15% further throwing than the Nichia 219s (recall: light decays with distance by an inverse square law).
Now let's roll all that up into my usual simple summary table for NiMH, broken down by emitter group for the L10 (given the statistically significant differences on Hi). Since there is no statistical reason to separate the lights by emitter on Firefly/Lo, I've left those fields common.
You'll note above that ceiling bounce numbers (which I provide as an additional output measure) suggest a greater output difference between the emitter types on Hi. I suspect this is due to the more throwy beam on the XP-G2 model (i.e., throwy beams tend to get higher ceiling bounce numbers, likely due to direct reflectance off the ceiling back to the sensor). As always, I recommend you go with the much better calibrated lightbox numbers.
For 1x14500 (3.7V Li-ion), the manufacturer recommends you don't run the light on this source, due to rapid heat buildup. In case you were wondering, here is a comparison table of estimated lumen outputs:
As you can see, all modes of the lights are much brighter on 14500. I have broken the Med/Hi results up by emitter on 14500, as t-tests suggest these are significantly different (no difference between emitters detected on Firefly or Lo). On the basis of these results, I also recommend you don't run the lights on Med or Hi on 14500, as the output considerably exceeds the Hi level of standard cells. You may thus damage the emitter or battery by the heat buildup (i.e., there is little thermal mass to help cool the light).
Another other thing to notice above is that the sub-lumen Firefly mode is actually maintained, although it is about four times brighter on 14500 (on average). Interesting, the variability measure stays about the same, which goes to show you that consistency between moonlight/firefly levels improves at the higher levels (i.e., the lower the moonlight level, the more relative variation you are likely to see).
One last comment about the above - don't get caught up on the implied precision of the lumen estimates. I provide 3 significant figures (sig figs, or sig digs/significant digits as the kids call them today) in that table abpve so that you can get a better feel of variability. I personally limit most of my tables to 2 sig figs, because I don't believe you should be inferring accuracy to the precision of my instumentation (i.e., just because I can measure my lumen estimates consistently doesn't mean it represents the "true" lumen value).
-----
Ok, that was a lot of data. :sweat: I know that was a long preamble to get to this point, but hopefully those of you who are more quantitatively-inclined will have appreciated it. :wave:
Runtimes
For comparison output/runtimes, I've picked a "representational" sample of each emitter group. In other words, I've picked a sample for each group that was relatively near the mean for that group (for both runtime and output).
Performance is pretty much what you would expect for a good XP-G/XP-G2 light – excellent regulation, and typical runtime for current-control.
Since the manufacturer recommends against running the lights on 14500, I have not done additional runtimes on this battery source.
Potential Issues
Lights roll easily.
Although impressively small for 1xAA lights, the L10s may still be a bit large for a keychain light.
Twisty lights that tighten to activate or change modes always have the potential to be battery crushers. Care needs to be used not to over-tighten, especially when mode switching.
Like with other lights in this slim-lined class, output levels are much higher on 14500 (3.7V Li-ion). The manufacturer recommends against running the lights this way (due to heat buildup), and I concur. I recommend you do not run these lights on Med or Hi on 14500 – best to limit yourself to Firefly/Lo modes (which are much brighter than on standard cells).
Preliminary Observations
The L10 by L3 Illumination is a nice slim-lined 1xAA light, very similar in functionality to a number of competing lights by Olight/ITP, Foursevens, Fenix, Thrunite and others. What really distinguishes the L10 is the stock option of the latest Cree emitter (XP-G2 cool white), or the popular Hi CRI Nichia 219 neutral white emitter. Decisions, decisions.
One nice feature is the use of current-control for the low modes on the L10. Although this is becoming increasing common, some of the earlier slim-lined designs from other makers used PWM (with potentially visible flicker). My L10 samples were all fully flat-regulated and visually stable on all levels, including Firefly.
Another difference here is that you have the option of a 3-level (Lo/Med/Hi) or 4-level (Firefly/Lo/Med/Hi) model. The only difference is the addition of the extra Firefly level at the start of the mode sequence. Note there is no mode memory, and the lights all start at their lowest level. Mode spacing seems good to me (and I personally like the dim Firefly mode).
Finally, you have the option of a range of anodized colors. Many lights remind me of the famous quote from Henry Ford - "any customer can have a car painted any colour that he wants so long as it is black."
The colors here are all reported as hard anodized (aka type III), and I certainly saw no signs of chips or damage on any of the ones I've handled. Body design is good for this class, with better grip than some (i.e., can easily use one-handed).The manufacturer doesn't recommend the use of 14500 Li-ion batteries (because of the high heat, due to the much higher output). I concur, and recommend you stick with standard AA cells (NiMH, alkaline or L91 lithium). Performance-wise, the current-controlled circuit worked consistently well in my testing. Runtimes are excellent for the class, and regulation was relatively flat.
Beam pattern is quite good on both emitter types, a fairly general purpose beam. I personally prefer the slightly smoother hotspot-to-spill transitions of the Nichia 219 – not to mention its neutral white tint and higher CRI. But that choice is yours.
As an aside, it was nice to be able to do some detailed sample variation testing on the L10. I don't get that opportunity very often, and the results here match my previous experience. To wit, Firefly/Moonlight mode output levels can be extremely variable between samples of the same model, but most regular modes are very consistent. In my experience, this significant variability is true of all lights with <1 lumen modes (particularly <0.1 lumen modes), which is why you see so many disagreements here about the actual lumen level of various people's n=1 samples.
Note that I didn't directly test runtimes at the low levels on the L10, but I have previously had the same experience on that front as well (i.e., runtimes are generally very consistent at higher outputs, and very variable at low ones).A nice addition to the simple, twisty-style class of 1xAA lights. Not much to criticize here, it seems like L3 Illumination has gotten this model right.
----
L3 Illumination L10 lights were supplied by sbflashlights.com for review.
Last edited: