
Curious_character
Flashlight Enthusiast
- Joined
- Nov 10, 2006
- Messages
- 1,211
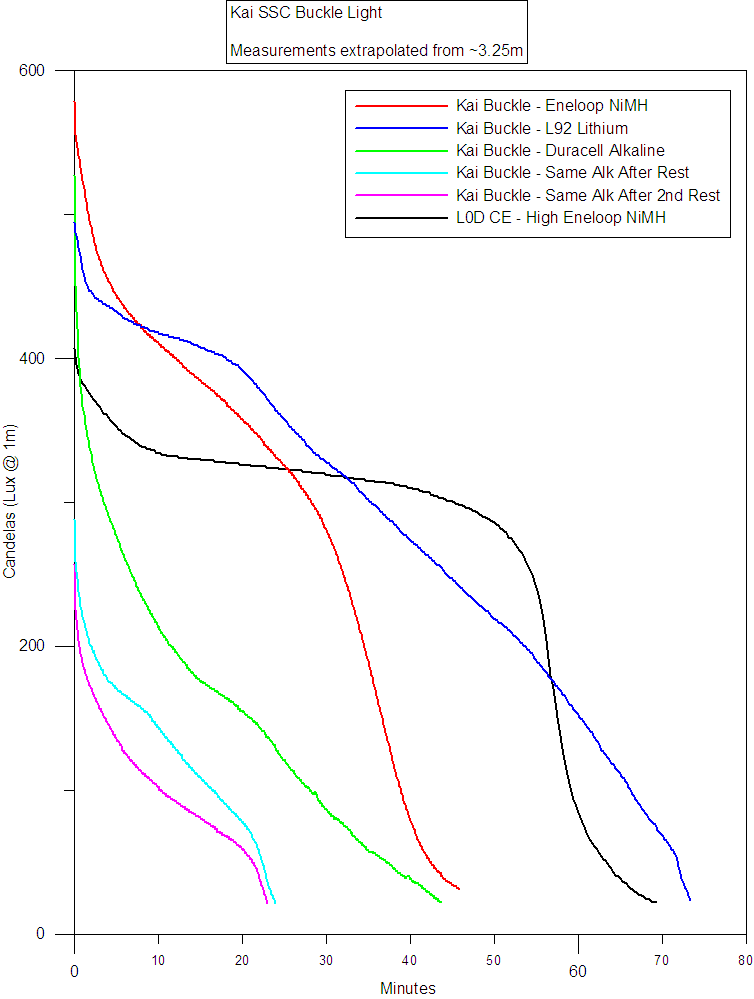
Here's the brightness of the main beam for the Kai Domain Buckle Light. I've added a plot of the L0D CE (highest setting) for comparison.
The total light output (lumens) of the Kai light is about 75% greater than the L0D CE with a freshly charged NiMH cell.
I did a second run with the same alkaline cell after giving it about an 18 hour rest, then a third run after about another 24 hours of rest. As you can see, there was still a fair amount of energy left in it each time. The amount of energy you can get out of an alkaline cell depends strongly on how you take it out, so a constant run time graph of the light with an alkaline cell only tells you what the light will do if you do actually just turn it on and let it run.
I used a linear scale for the above graph simply because it seems to be traditional on this forum, and using the same scale type makes it easier to compare graphs. But I always plot light intensity graphs for myself on a logarithmic light scale, because the shape of the curve more accurately represents how the eye perceives light intensity. Each time you cut the light intensity in half, it seems like it's dropping by the same increment, rather than by the same ratio. That's exactly what the log plot does -- every reduction by the same factory (for example, cutting in half) is shown as the same distance on the Y axis. I feel that this light's performance with repeated runs using the same alkaline cell is better represented with a log plot, so here's exactly the same data as above, but with a logarithmic instead of linear light scale:
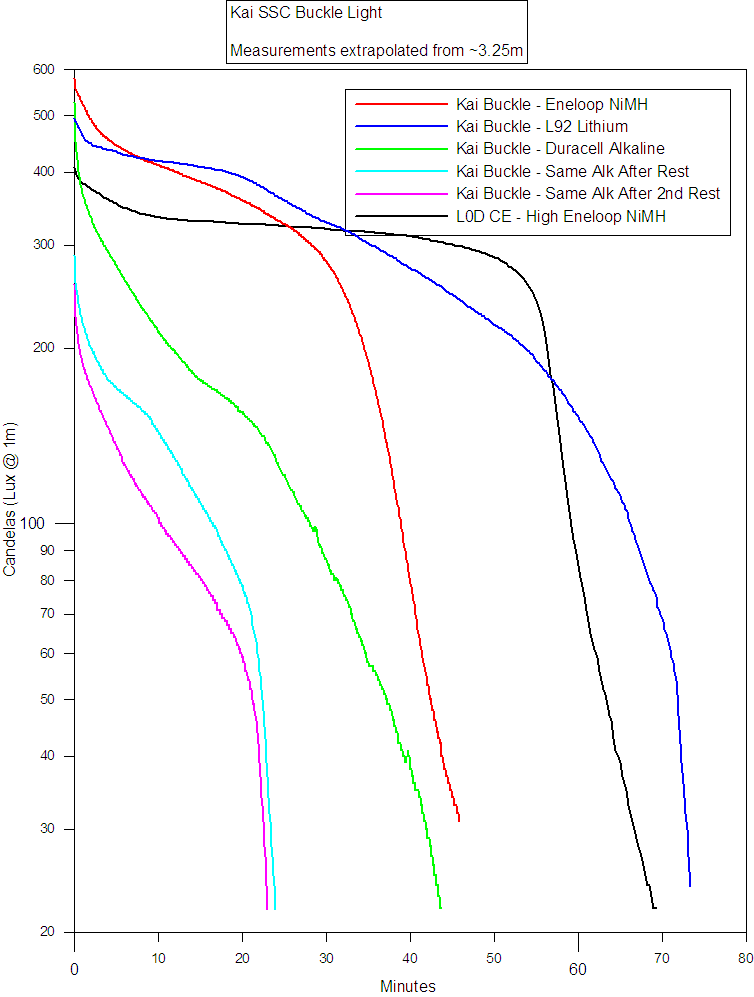
Notice that the distance from 400 to 200 on the Y axis is the same as from 200 to 100 and from 100 to 50. Your perception of brightness is something like this, where if you cut the light in steps of a factor of two, it would look like you're reducing it in equal size, rather than ratio, steps.
c_c
The total light output (lumens) of the Kai light is about 75% greater than the L0D CE with a freshly charged NiMH cell.
I did a second run with the same alkaline cell after giving it about an 18 hour rest, then a third run after about another 24 hours of rest. As you can see, there was still a fair amount of energy left in it each time. The amount of energy you can get out of an alkaline cell depends strongly on how you take it out, so a constant run time graph of the light with an alkaline cell only tells you what the light will do if you do actually just turn it on and let it run.
I used a linear scale for the above graph simply because it seems to be traditional on this forum, and using the same scale type makes it easier to compare graphs. But I always plot light intensity graphs for myself on a logarithmic light scale, because the shape of the curve more accurately represents how the eye perceives light intensity. Each time you cut the light intensity in half, it seems like it's dropping by the same increment, rather than by the same ratio. That's exactly what the log plot does -- every reduction by the same factory (for example, cutting in half) is shown as the same distance on the Y axis. I feel that this light's performance with repeated runs using the same alkaline cell is better represented with a log plot, so here's exactly the same data as above, but with a logarithmic instead of linear light scale:
Notice that the distance from 400 to 200 on the Y axis is the same as from 200 to 100 and from 100 to 50. Your perception of brightness is something like this, where if you cut the light in steps of a factor of two, it would look like you're reducing it in equal size, rather than ratio, steps.
c_c
Last edited:
