Tobias Bossert
Newly Enlightened
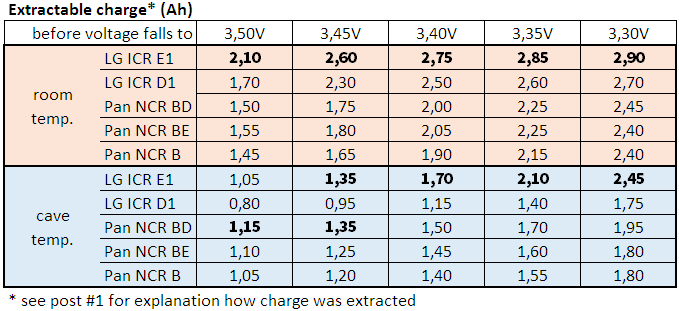
Henrik K. Jensen (HKJ) publishes comprehensive discharge measurements for various battery models. All these curves are for continuous discharge at room temperature. However, most people do not use their flashlight continuously in the same setting until battery is empty and at other temperatures too.
Cavers for example use their headlight at a low setting (typical 0,1 to 0,5 A) for walking and climbing all over the day until battery is empty. Nevertheless, sporadically they use the light in boost mode (typical 2 to 4 A) for short time. The curves for continuous discharge do not cover this kind of usage.
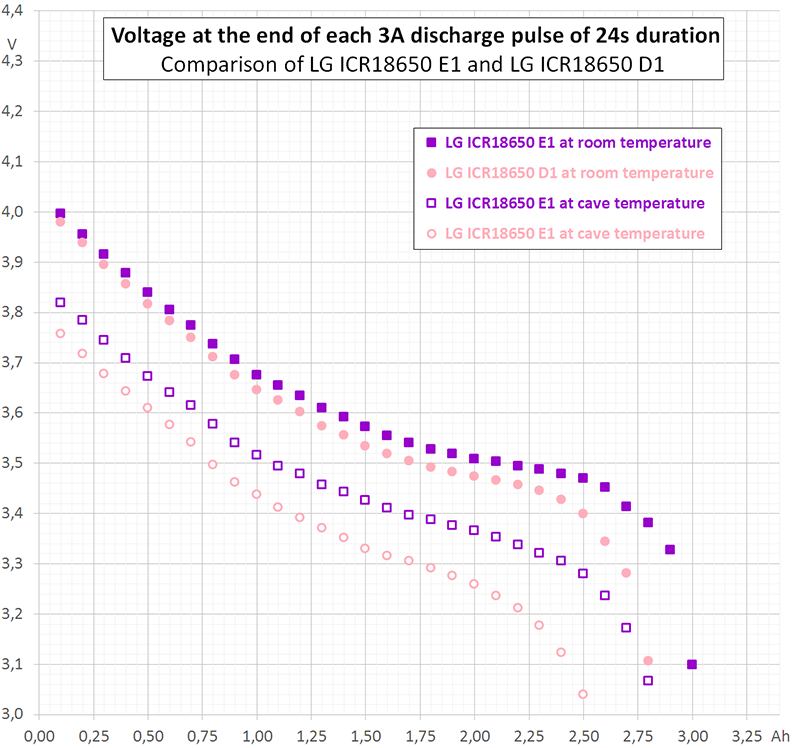
To get an idea of effects like depolarisation or internal heating of the cell, I carried out some measurements with two recent samples of LG ICR18650 D1.
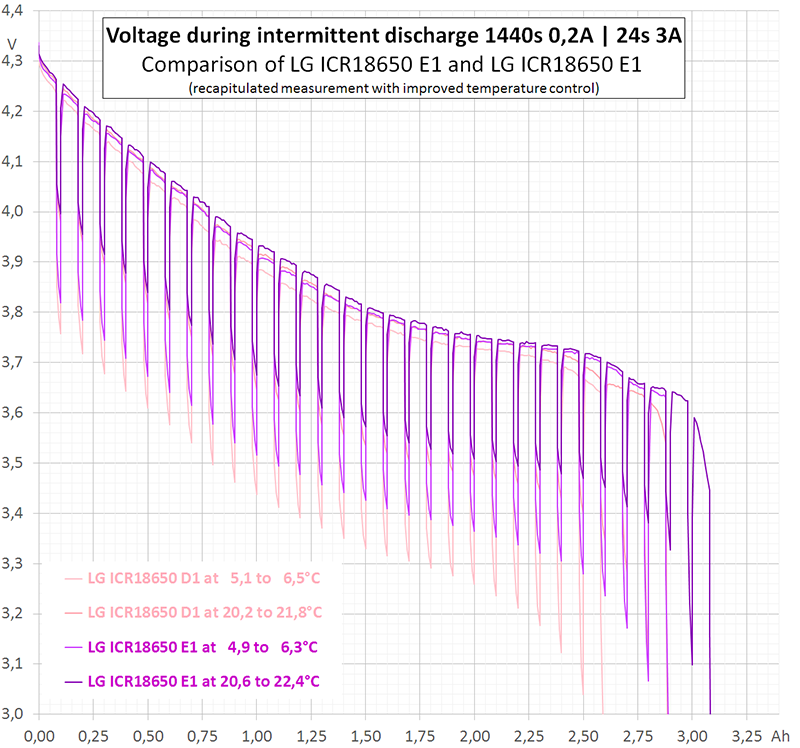
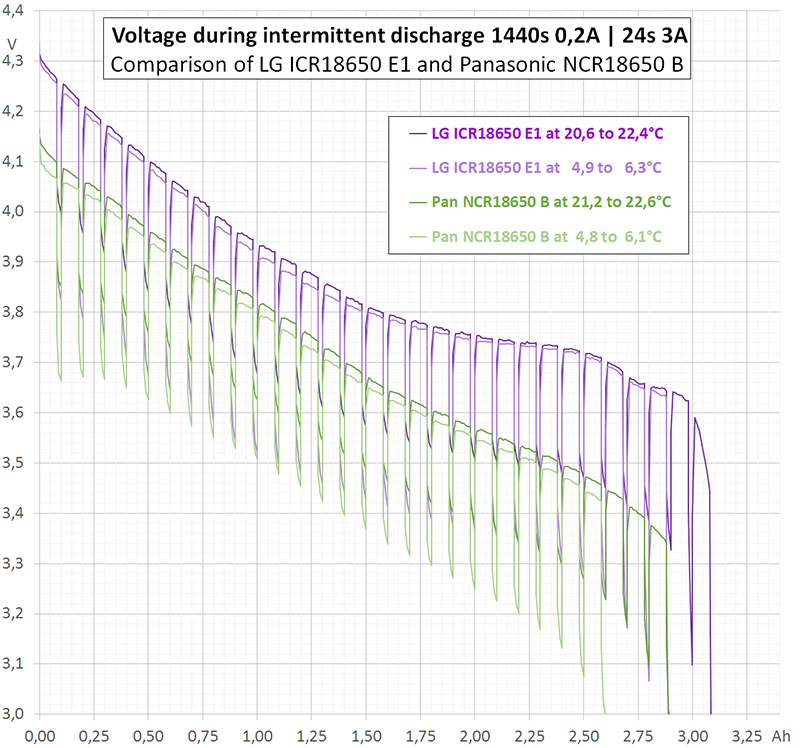
I performed three different kinds of measurement (diagram 1). Two of them, continuous 0,2 A (blue) and continuous 3 A (red) are rather redundant, since HKJ already has done them. The third measurement (purple) was intermittent with the following cyclical time scheme: 0,2 A during 1440 s (= 80 mAh) followed by 3 A for 24 s (= 20 mAh). Each cycle discharges 100 mAh. In the average, 80% of charge is extracted at 0,2 A and 20% at 3 A.
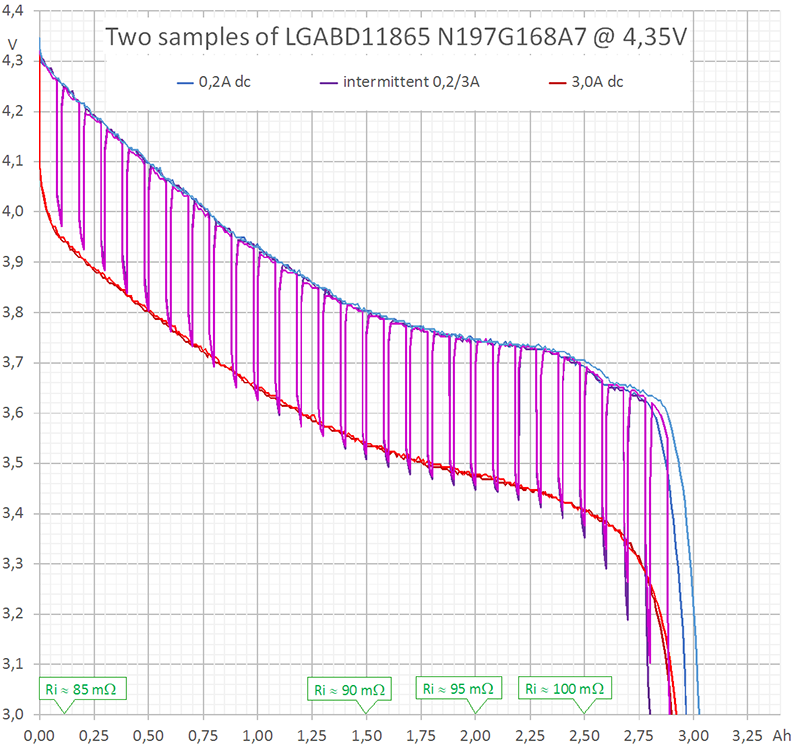
Diagram 1 larger image
If there would be neither depolarisation effects nor internal heating, the purple curve would jump between the blue and the red curve exactly.
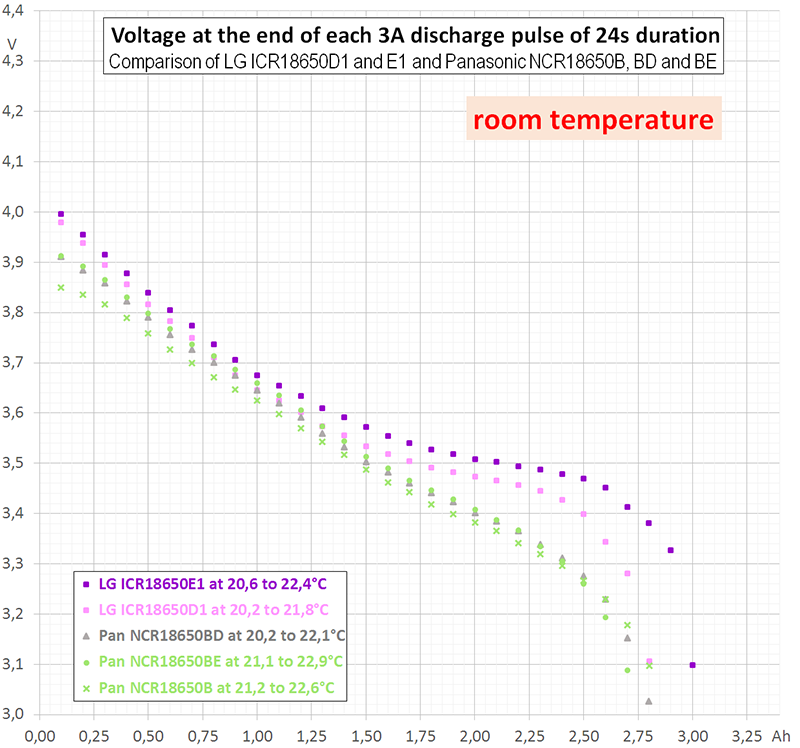
I performed these first measurements at room temperature (19 to 21°C). Internal heating of the cell can be neglected during continuous discharge at 0,2 A. This is true even for intermittent discharge. However, during continuous discharge at 3 A the cell heats up to more than 40°C (temperature not measured). This explains why the upper part of the purple curve in diagram 1 follows the blue curve, but the lower part differs from the red curve.
Diagram 2 shows the purple curve of one sample zoomed in to a small part of diagram 1.
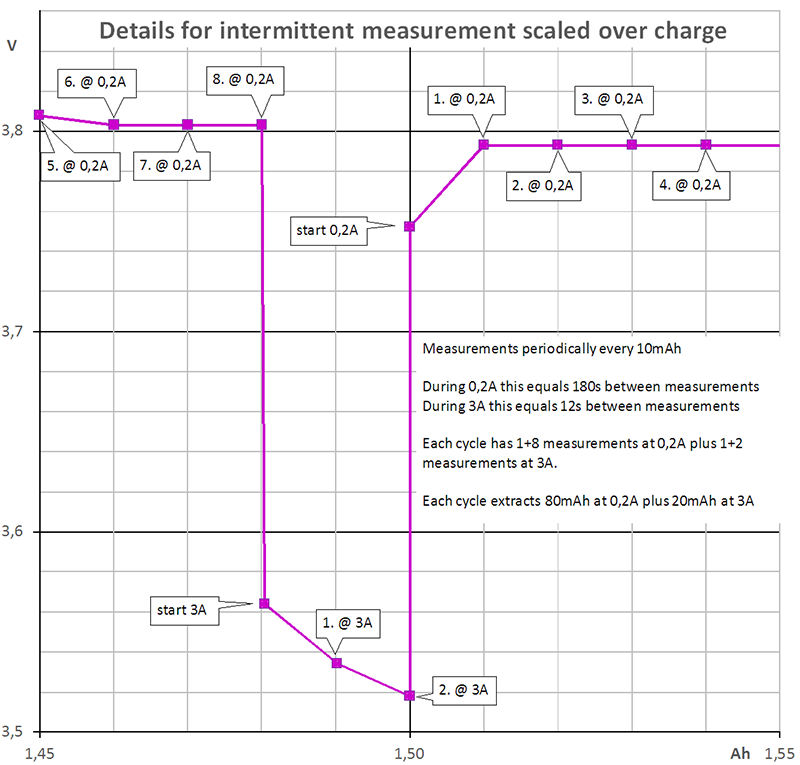
Diagram 2
The program takes one measurement every 10 mAh. During discharge at 0,2 A this means, it takes a measurement every 180 s. During discharge at 3 A, it takes a measurement every 12 s. Additionally the program takes one measurement immediately after switching the current. Each cycle contains 9 + 3 measurements.
Diagram 3 shows the same small sequence as diagram 2. However, the vertical axis scales in time, not in charge as in diagram 2.
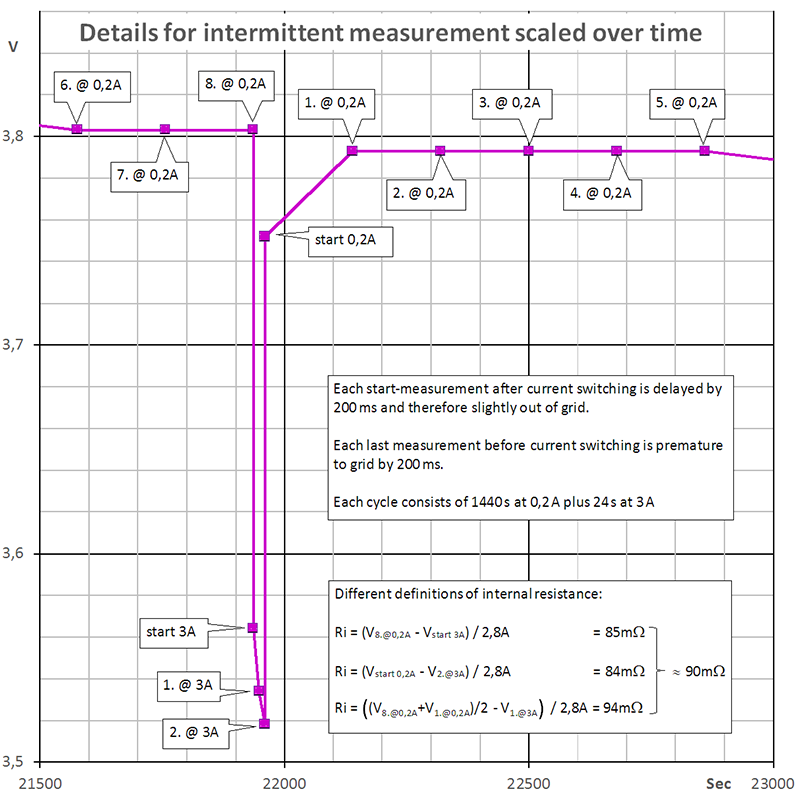
Diagram 3
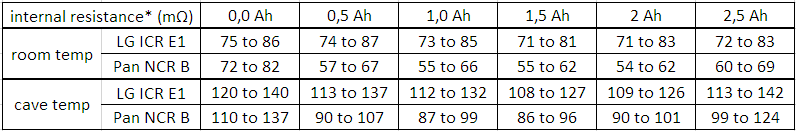
It is obvious that voltage will sag when current increases due to the internal resistance of the battery. However, the voltage sag is varying over time, mainly due to depolarisation effects. To demonstrate these effects in detail it would be necessary to sample the curvature at a higher sample rate.
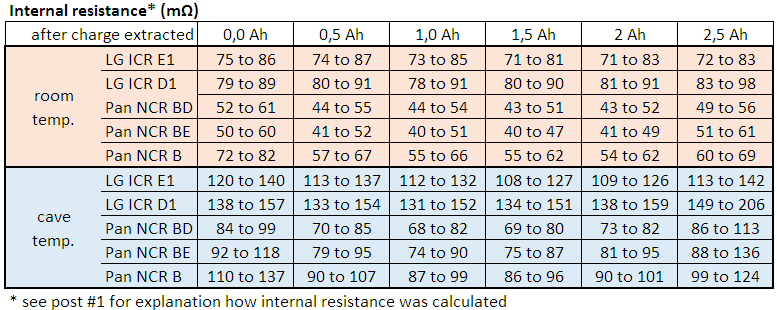
If you are interested in something like pulse response (short time behaviour, whatever "short" means) you should take the vertical step height of the curvature, i.e. from immediately before current switching [8. @ 0,2A] to immediately after switching [start 3A] or vice versa from [2. @ 3A] to [start 0,2A]. This kind of "internal resistance" equals about 85 mΩ in diagram 3.
If you are interested in average voltage sag, you rather should take some average voltage before and after the pulse (whatever "after" means) and compare it to the average or a typical value during the pulse. This kind of "internal resistance" equals about 95 mΩ in diagram 3.
Astonishingly, at the beginning of discharge the intermittent curve does not touch the continuous curve. However, at the end of discharge the intermittent curve falls below the continuous one. An explanation to that may be, that depolarisation and heating act contrarily: Heating reduces the internal resistance ("helps") but has an extremely long time constant.
Warning!
This thread will grow over weeks, since I plan to make additional measurements:
These future updates just will add new intermittent measurements rather than repetitions of all those detailed explanations. Additionally, I will not measure any blue and red curves anymore, since HKJ is the preferable source for that: I will add purple curves only.
Cavers for example use their headlight at a low setting (typical 0,1 to 0,5 A) for walking and climbing all over the day until battery is empty. Nevertheless, sporadically they use the light in boost mode (typical 2 to 4 A) for short time. The curves for continuous discharge do not cover this kind of usage.
To get an idea of effects like depolarisation or internal heating of the cell, I carried out some measurements with two recent samples of LG ICR18650 D1.
I performed three different kinds of measurement (diagram 1). Two of them, continuous 0,2 A (blue) and continuous 3 A (red) are rather redundant, since HKJ already has done them. The third measurement (purple) was intermittent with the following cyclical time scheme: 0,2 A during 1440 s (= 80 mAh) followed by 3 A for 24 s (= 20 mAh). Each cycle discharges 100 mAh. In the average, 80% of charge is extracted at 0,2 A and 20% at 3 A.
Diagram 1 larger image
If there would be neither depolarisation effects nor internal heating, the purple curve would jump between the blue and the red curve exactly.
I performed these first measurements at room temperature (19 to 21°C). Internal heating of the cell can be neglected during continuous discharge at 0,2 A. This is true even for intermittent discharge. However, during continuous discharge at 3 A the cell heats up to more than 40°C (temperature not measured). This explains why the upper part of the purple curve in diagram 1 follows the blue curve, but the lower part differs from the red curve.
Diagram 2 shows the purple curve of one sample zoomed in to a small part of diagram 1.
Diagram 2
The program takes one measurement every 10 mAh. During discharge at 0,2 A this means, it takes a measurement every 180 s. During discharge at 3 A, it takes a measurement every 12 s. Additionally the program takes one measurement immediately after switching the current. Each cycle contains 9 + 3 measurements.
Diagram 3 shows the same small sequence as diagram 2. However, the vertical axis scales in time, not in charge as in diagram 2.
Diagram 3
It is obvious that voltage will sag when current increases due to the internal resistance of the battery. However, the voltage sag is varying over time, mainly due to depolarisation effects. To demonstrate these effects in detail it would be necessary to sample the curvature at a higher sample rate.
If you are interested in something like pulse response (short time behaviour, whatever "short" means) you should take the vertical step height of the curvature, i.e. from immediately before current switching [8. @ 0,2A] to immediately after switching [start 3A] or vice versa from [2. @ 3A] to [start 0,2A]. This kind of "internal resistance" equals about 85 mΩ in diagram 3.
If you are interested in average voltage sag, you rather should take some average voltage before and after the pulse (whatever "after" means) and compare it to the average or a typical value during the pulse. This kind of "internal resistance" equals about 95 mΩ in diagram 3.
Astonishingly, at the beginning of discharge the intermittent curve does not touch the continuous curve. However, at the end of discharge the intermittent curve falls below the continuous one. An explanation to that may be, that depolarisation and heating act contrarily: Heating reduces the internal resistance ("helps") but has an extremely long time constant.
Warning!
This thread will grow over weeks, since I plan to make additional measurements:
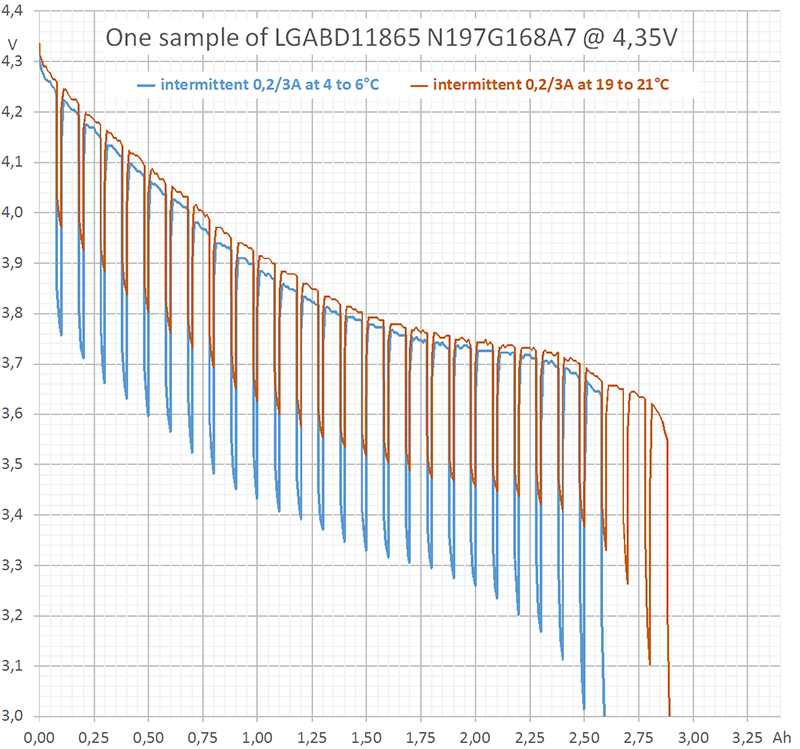
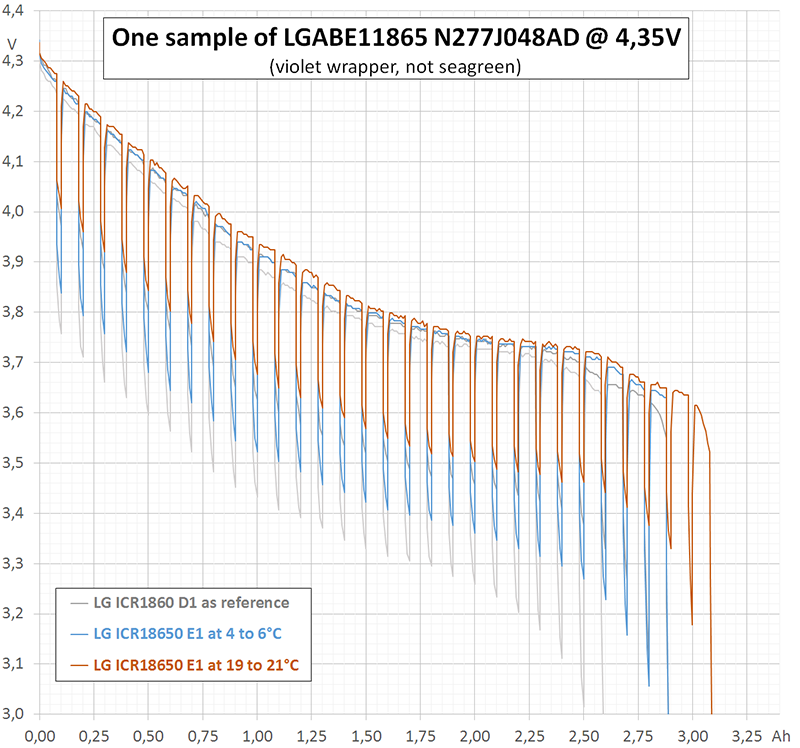
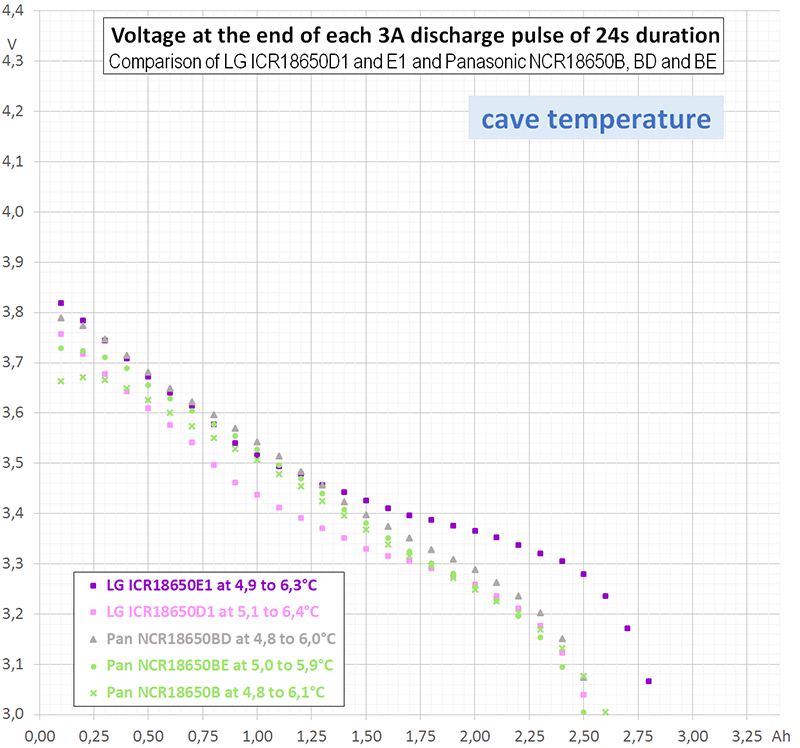
- Intermittent measurements at lower temperature, since room temperature does not cover all application (some caves are rather cold).
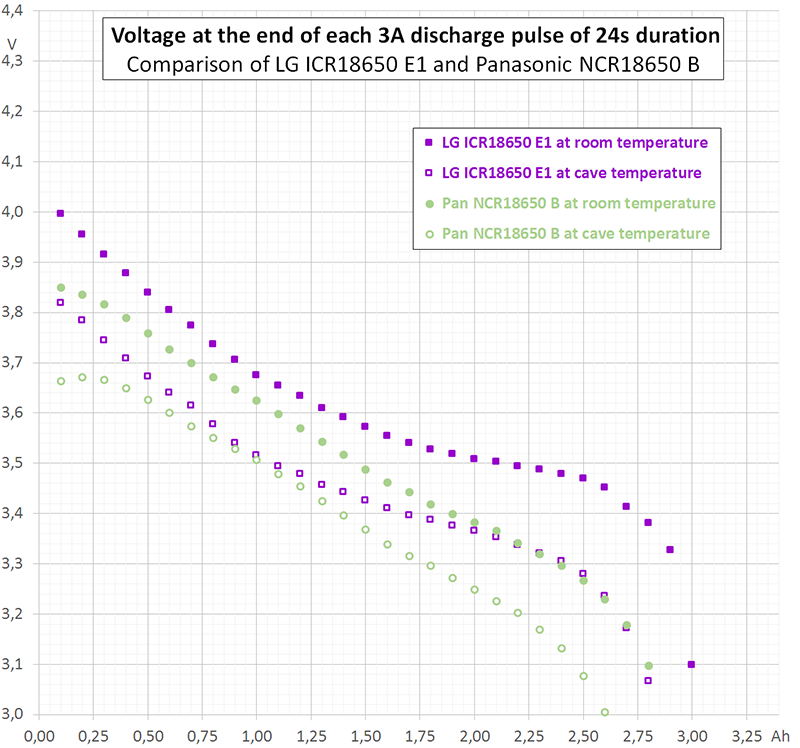
- Intermittent measurements at room and at lower temperature for other battery models, since there are some good batteries on the market other than LG ICR18650 D1 too.
These future updates just will add new intermittent measurements rather than repetitions of all those detailed explanations. Additionally, I will not measure any blue and red curves anymore, since HKJ is the preferable source for that: I will add purple curves only.
Last edited: