wptski
Flashlight Enthusiast
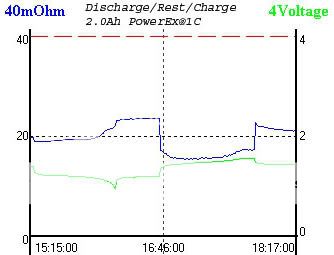
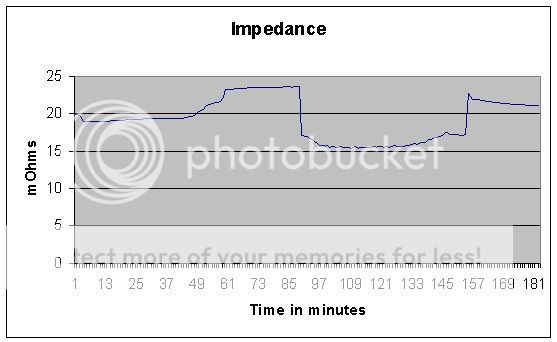
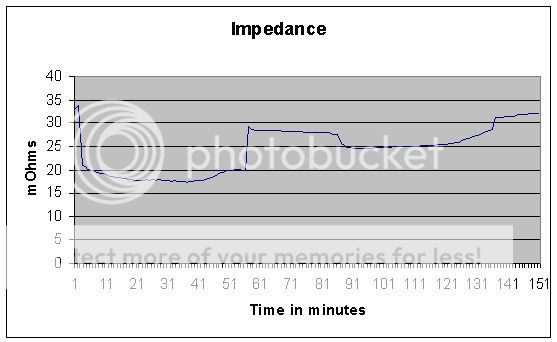
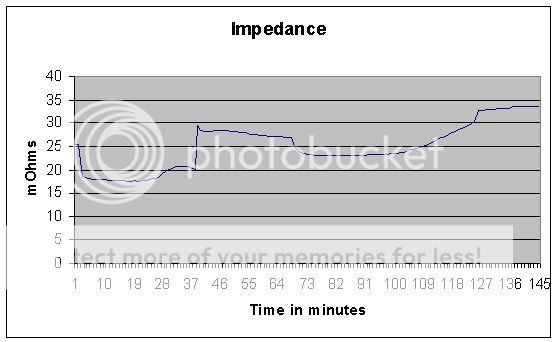
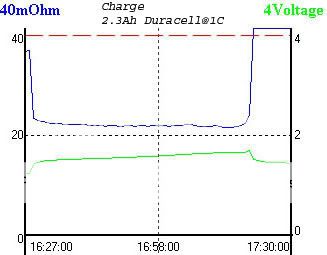
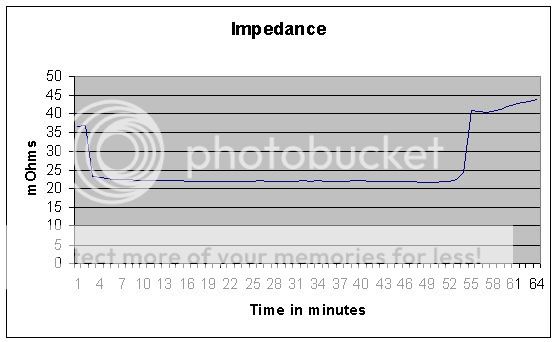
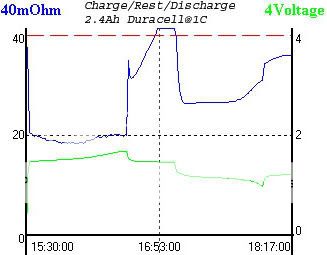
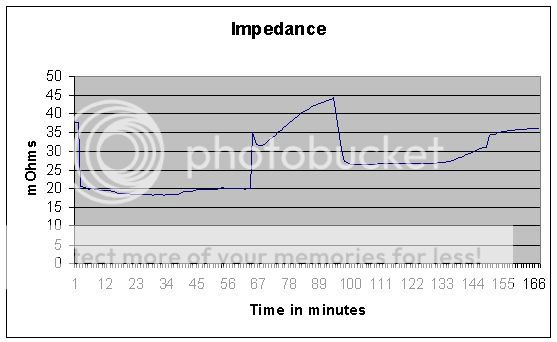
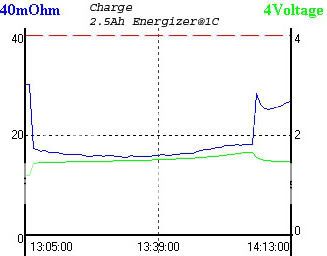
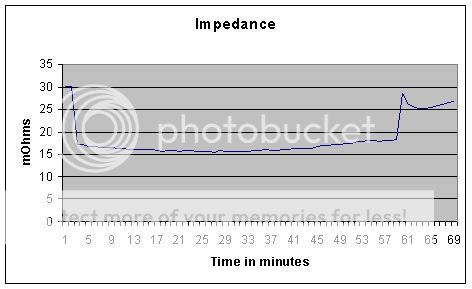
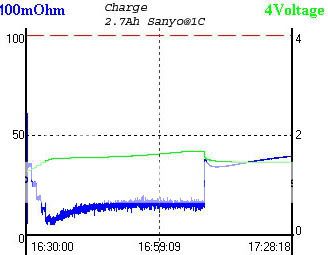
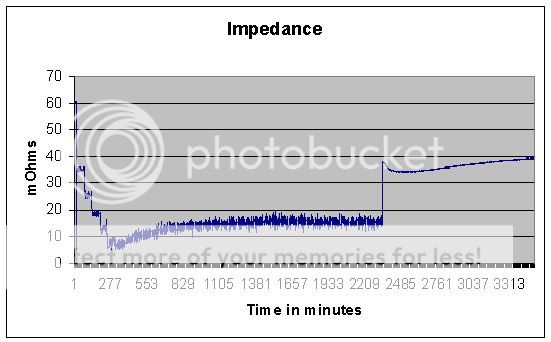
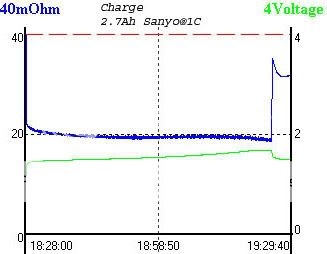
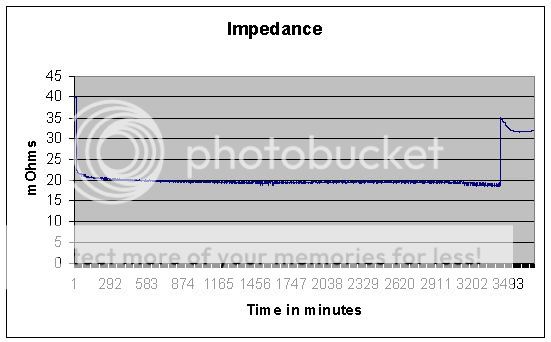
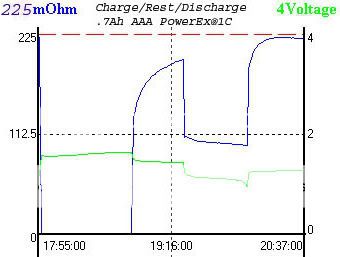
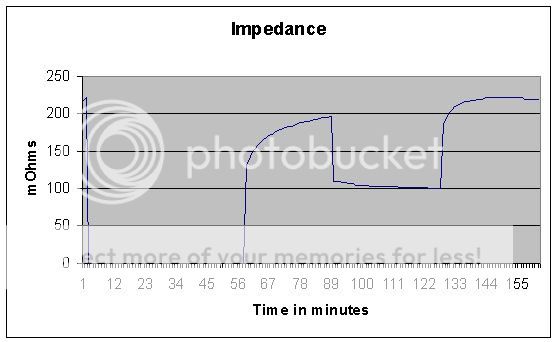
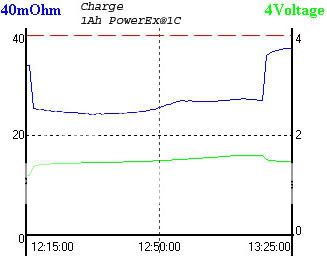
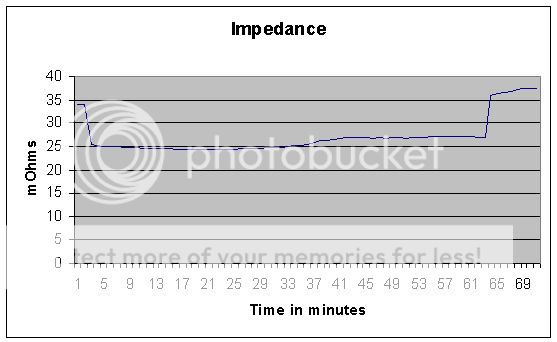
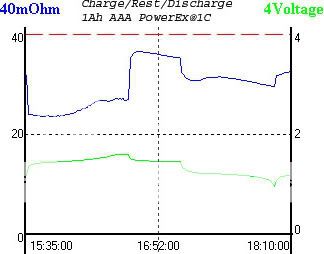
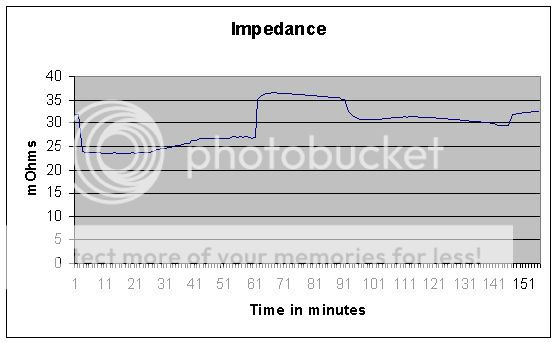
I'm posting this series of impedance graphs of various AA/AAA cells. I used a Duratrax ICE charger and a Extech BT100 to perform these tests. The ICE only allows up to thirty minutes rest between a charge and discharge cycle. Most of the tests were done with discharged cells but a few weren't but the graph has a note. The graphs on the left are impedance and voltage but since it didn't provide any real grid to calculate the level of impedance very close, I redid the impedance values in Excel which is on the right of each.
Impedance in milliohms is a very small value and very sensitive. A cell might read 30 mOhms by itself but when you try to clamp it for logging, you always gain a few mOhms! So the graphs tend to read a few mOhms higher than actual cell impedance. Since I was just trying to see what cells do while charging/discahrging, a few mOhms doesn't matter.
What you'll notice here is that some cells increase at times while others decrease. I you search the net, you'll find statements where impedance increases when a cell is discharged and increases when it's charged! Well some do and some don't. The lower the impedance the better and the lowest that I've seen was PowerEx 2Ah AA at about 15-17mOhms.
There's been talk here about using spring type holders for charging multiple cells. I have several kinds, four, six and eight cells for AA's. I took four AA's in series while held in a piece of PVC pipe and check the total impedance and then check it while in these various holders. The Radio Shack eight cell holder had half the impedance of the others!
If it looks confusing, it is!