neoseikan
Enlightened
- Joined
- Dec 2, 2006
- Messages
- 611
Runtime & total output
A lot of works have been done by great CPF reviews such as Chao, Selfbuilt, c0t0d0s0, Chevrofreak, and BigWaffles. One of the important work from them is drawing runtime curves of so many flashlights. WIth the curve, we can see the different specs easier and more intuitively.
With a reasonable measurement on relative overall light output, we can know more about the flashlight. Fortunately, we have these measurements. Selfbuilt measured the overall output of every lights with his lightbox, so, we can compare the total output ability of different lights now.
With photoshop, every one can get the area size infomation of an area surrounded by the curve and x-y axis. The area size means the total amount of lights from a flashlight.
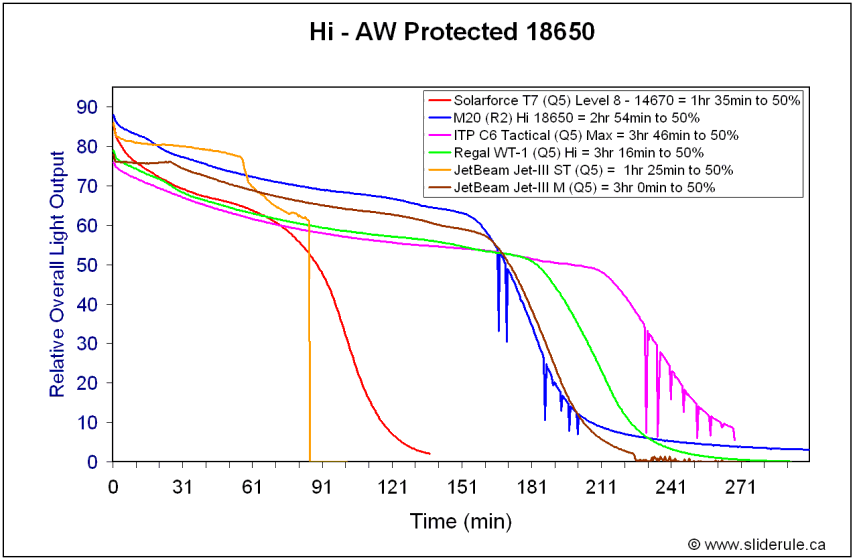
Here is some runtime curves from selfbuilt, I borrow them to find the hidden specs of flashlights.
Firstly, let's have a look on these 18650 lights.

1- ITP C6: 125595 pixels
2- M20 121333 pixels
3- Regal WT-1 114355 pixels
4- Jetbeam Jet III-M 112768 pixels
5- Solarforce T7 62536 pixels (14500)
6- Jetbeam Jet III ST 58870 pixels
Now, we can see the relative output is:
12.6 -> 12.1 -> 11.4 -> 11.3 -> 6.3 ->5.9
Supposed all of them used the same amount of energy (except for Solarforce T7), the relative output means relative efficiency too.
NOTICE: The efficiency of the same light varies at different output levels or different time point. What you seen here is a relative overall value.
Let's see more.
They are AA lights with Sanyo Eneloop.

Fenix L1D : 140519
Nitecore D10: 116889
Jet I Pro: 106629
Jet I MK IBS: 106566
Nitecore DI: 104617
It's
14->11.7->10.7->10.7->10.5
NOTICE: The Y axis is different with the upper chart, so, the numbers listed here and there means different things.
Any one like this way?
A lot of works have been done by great CPF reviews such as Chao, Selfbuilt, c0t0d0s0, Chevrofreak, and BigWaffles. One of the important work from them is drawing runtime curves of so many flashlights. WIth the curve, we can see the different specs easier and more intuitively.
With a reasonable measurement on relative overall light output, we can know more about the flashlight. Fortunately, we have these measurements. Selfbuilt measured the overall output of every lights with his lightbox, so, we can compare the total output ability of different lights now.
With photoshop, every one can get the area size infomation of an area surrounded by the curve and x-y axis. The area size means the total amount of lights from a flashlight.
Here is some runtime curves from selfbuilt, I borrow them to find the hidden specs of flashlights.
Firstly, let's have a look on these 18650 lights.

1- ITP C6: 125595 pixels
2- M20 121333 pixels
3- Regal WT-1 114355 pixels
4- Jetbeam Jet III-M 112768 pixels
5- Solarforce T7 62536 pixels (14500)
6- Jetbeam Jet III ST 58870 pixels
Now, we can see the relative output is:
12.6 -> 12.1 -> 11.4 -> 11.3 -> 6.3 ->5.9
Supposed all of them used the same amount of energy (except for Solarforce T7), the relative output means relative efficiency too.
NOTICE: The efficiency of the same light varies at different output levels or different time point. What you seen here is a relative overall value.
Let's see more.
They are AA lights with Sanyo Eneloop.

Fenix L1D : 140519
Nitecore D10: 116889
Jet I Pro: 106629
Jet I MK IBS: 106566
Nitecore DI: 104617
It's
14->11.7->10.7->10.7->10.5
NOTICE: The Y axis is different with the upper chart, so, the numbers listed here and there means different things.
Any one like this way?

