
jeff51
Newly Enlightened
Warning – Long POST
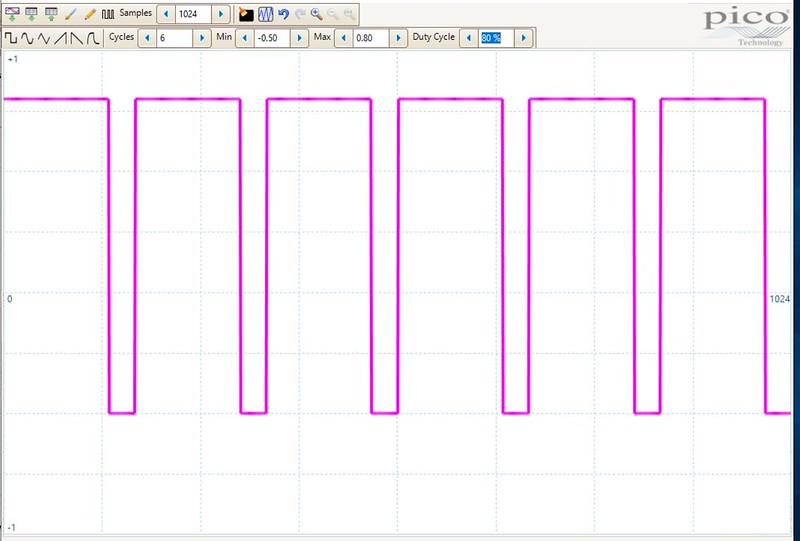
PWM 10% Duty Cycle

PWM 80% Duty Cycle
Pulse Wave Modulation (PWM) is a commonly used method to control the brightness of LED lights.
This Sticky goes into detail on PWM.
https://www.candlepowerforums.com/v...t-is-it-How-does-it-work-and-how-to-detect-it
Lights with poor PWM are a real problem if used for any length of time. For finding dropped car keys it's no big deal. Using a light with noticeable PWM for any length of time leads to eyestrain and headaches in fairly short order.
Detecting low frequency PWM is as easy as waving something in front of the light (the Finger Wave). Lights with poor PWM characteristics look like an old time movie or a series of stop motion photos.
Waving the light quickly and taking a photo shows lights with a faster PWM – up to a point.
PWM at 500Hz is easy to see
Lights with fast PWM are hard to distinguish from lights running a constant voltage.
PWM at 16KHz – I can't detect anything.

To find out if a light is using a fast PWM some sort of detection device is needed.
I got interested in PWM because I bought some lights with just plain crappy PWM.
I have an old oscilloscope but it is a pain to use and an even bigger pain to capture a photo of the PWM wave. Finding out the PWM frequency requires measuring the trace on the screen and plugging the value into a formula. Getting a duty cycle involves more of the same.
This got me interested in seeing just what a hobbyist could cobble together to measure PWM frequencies using free or very low cost equipment.
There are three things needed (well two if using a Multimeter with a Frequency Counter).
First convert light into volts.
Next sample the analogue voltage and convert it to numbers (digitizing)
Finally use something to analyze the result and present it in a useful manner.
I tested three free software applications to measure PWM.
The third software package proved the most useful for testing PWM.
Jump down to the heading: Visual Analyzer to skip all the steps leading up to using that software.
Actually there is a fourth important step. Making sure the voltage source does not kill the digital to analogue converter (the computers sound card).
Over in the BLF there is a lengthy POST from ToyKeeper about seeing/detecting PWM by using a photo and other methods.
http://budgetlightforum.com/node/67041
The CPF Sticky thread mentioned above is a good place to start understanding what PWM is all about and different methods to see if a light is using PWM.

First convert Photons to Volts.
I had a cheap PV cell that I got somewhere for about $3. Other sources are solar calculators or any of the thousands of cheap solar rechargeable thingies that seem to be everywhere. Smaller is better in this case.
Lights – Volts - Counting
If you have a DMM with a frequency function, this maybe all you need. Start in a dark room. Hook the PV cell to the meter. Shine a light with a known PWM at the ceiling and see if you can get a reading. If not try bringing the light closer to the PV cell and see if that gets you a freq. count.
You might need to put some resistance (1K to 10K Ohms) in parallel with the PV cell to cut down on the DC offset.
This does not work with all DMMs with Frequency counters for some reason.
My old Fluke meters don't have a Frequency function. So I went looking for another method.
Lights – Volts - Sound
Another way to detect PWM is with your ears. Hook a PV cell to an old powered computer speaker.
Here is an example:
https://www.candlepowerforums.com/v...-How-does-it-work-and-how-to-detect-it/page11 POST 309
Lights – Volts
Converting photons to volts is fairly easy. A Solar Cell (PV Cell) ripped out of any sort of cheap solar powered device should be easy to find. If not they sell for a buck or two on eBay. Bigger is not better. A small cell works just fine.
PV cells will put out a DC voltage. That's something that needs to be limited to protect the A to D device (the sound card). Running a resistor in parallel with the PV cell output will do this nicely. The amount of resistance needed depends on the PV Cell and how bright the light is. I found 200 Ohms to 5K Ohms worked for me.
Hook the PV cell and the resistor to a DMM and measure the output voltage in room lighting and in the dark with various lights bounced off the ceiling or shining on the PV cell. Make a note of the voltages.
Volts from Office Lights

Volts from a 400 Lumen light

Controlling the Brightness
A light on Moonlight setting is about a zillion times dimmer that the supernova Turbo setting. This makes getting a good output signal from the sensor hard to do. I initially used a series of filters to control brightness.
This proved to be more trouble in the long run. Pointing the light away from the sensor and bringing it closer if more signal was needed proved to the easiest way.
Use the Voltmeter to get an idea of what the output of the PV circuit is depending on the way the light hits the cell. This will be used in deciding how to deal with the sound card input.
An LED can be used as a sensor. Yes – they work backwards (much like me). Once again use a voltmeter to test the output and match that to the sound cards input.

LEDs used as sensors have problems with dim lights. Catching a signal from moonlight mode is tough. See the BLF thread from Terry mentioned below for tests of LEDs used as sensors (LEDs as sensors are tested on the second and third page).
The other alternative is to use a photo diode in a simple circuit. The advantage of a photo diode is a much faster response time to get a better look at the waveform. Using the proper source voltage or a correct resistor value will limit the possibility of overdriving the computers sound card.
After reading the excellent review of various diodes (etc.) for measuring PWM by Terry Oregon:
http://budgetlightforum.com/node/61254
I decided to see if I could get hold of the OSRAM BPW34
I found this on Amazon
https://www.amazon.com/dp/B00B88FFDA/?tag=cpf0b6-20
5 of them for less than $11 (when I bought mine) for a BPW34. No need to wait for China, hopefully they would be similar to the one tested.
The envelope arrived and I thought it was empty. Inside was a second envelope with the BPW34(s). No documentation at all.

Geeze these things are small! Thanks to Terrys' post – I know the negative side is one to the right in the photo. It has a bar and dot.
I built this setup to convert Photons to Volts

I used a tube to hold the sensor (diode), a battery holder for a 16850, and a spot to hook the scope across the resistor array. Hot glue holds it all together. The battery is connected in series with the diode and the resistor(s).
A lid for the tube held the light and filters to control brightness.
I started off using (5) 10K resistors. This provided a good voltage even with very low light levels. After some experimenting I eventually arrived at using a 2.5K Ohm resistor in series with the negative side of the photo diode.
The lower the resistance, the faster the diode will respond to voltage changes. The better photo diodes are much better than PV cells or LEDs connected as a sensor.
A light with a very Low duty cycle PWM.
Photo diode vs PV cell.
PV Cell (no resistance added) on the top - Photo diode on the bottom.

And the winner is the Diode for a faster response.
At first I used a series of filters to limit brightness. Too much light and the signal would start to clip and give a false reading. I used really high tech filters. I chopped them out of those dark film thingies you get from the eye doctor.

I later made the tube longer and laid it horizontally. That way I could keep the overhead lights on and not shine them on sensor. The brightness is controlled by shining more of less of the beam into the tube.

Limiting Voltage
I used the PV cell in my first experiments. Later I built the diode sensor mentioned above.
The important thing to remember is that you are plugging a voltage source directly into your PC sound card. Push too many volts at it and PUFF – the magic smoke gets out and you kill the card.
I suggest using an external USB sound card. That will protect the motherboards internal card from OH!-NO! Seconds. Sound card input voltages are in the order of 50mV for Mic inputs or 1.5v for line inputs. Some (note the word some) Mic inputs can handle line level signals. This is controlled in the soundcard properties.
Use a volt meter to measure the output of your sensor. Plan accordingly. The total voltage can be limited by making sure not to shine the light directly on the sensor. Limiting the source voltage in the diode sensor circuit is another way to keep things safe.
Using a 1.2 volt battery as the power supply puts one of these circuits within or very near the safe limits of a LINE Level soundcard. Using a higher voltage battery for supply power requires limiting the sample voltage.
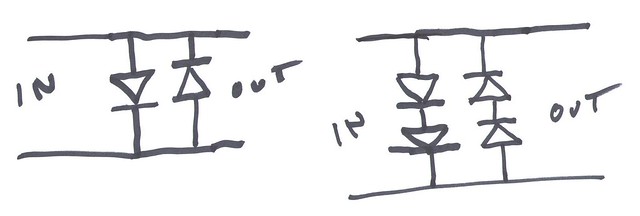
Using a pair of diodes in opposition across the sensor output will limit the voltage. Above .7V or so the signal will clip. Use 4 diodes, two in series, in parallel with a second pair (oriented in the opposite direction) will bump the limit to 1.4V or so. A 1N4148 is really cheap and works.
Building a simple resistor circuit will divide the voltage into something safe. To do it correctly the input impedance on the soundcard needs to be known and plugged into a formula.
Who knows that? Instead just arrive at the value by trial and error.
Here is a shot of my setup with a bunch of 10K resistors in series.

Just measure the voltage across the output with the sensor bypassed to check the max voltage.

At the end of the POST I'll leave links to an article about different front ends for sound cards.
It makes a lot of sense to use an external soundcard to prevent the built-in one from getting smoked. Many users are getting satisfactory results with an ultra cheap card like this one.
https://www.dx.com/p/usb-virtual-7-1-channel-external-sound-card-adapter-2009693
or
https://www.dx.com/p/external-5-1-c...ical-audio-adapter-black-2008145#.XU3IDG5Fyck
Given a choice, finding something that lists a LINE level input is preferable to a MIC only input. But it seems these cheap cards with a MIC input are being used with good results.
Converting Volts to Numbers
Everyone with a computer has an Analog to Digital converter - the sound card. The problem is that soundcard are, well, soundcards. They are mostly designed for output. They convert digital signals (music) into analog (voltages) to plug into an external sound system (5.1 or 7.1 outputs). At most they will have a 2 channel LINE input and a 2 channel (or sometimes mono) MIC input.
Using the soundcard as an input has its limits (literally)
First is the frequency. Most soundcards have a 48KHz sample rate limiting bandwidth to 24KHz. As the signal approaches the upper Freq. limits, the number of samples covering the wavelet gets smaller. As such the rendition of a complex wave is distorted. A 48KHz card has real problems looking at a 16.5KHz wave. There are just not enough samples to work with. Google Nyquist for more info.
However the frequency can still be measured accurately as it approaches the bandwidth limit.
There are 192KHz sound cards. ASUS and Creative make internal ones that sell for $40.
External 192K cards are pushing $100 or more.
Unless you have use another use for a high resolution sound card, it makes no sense to spend that kind of money on an external card. A cheap oscilloscope can be had in the same price range.
There are sound cards that are more suitable if you look on the music biz side of things.
https://www.sweetwater.com/store/detail/UMC202HD--behringer-u-phoria-umc202hd-usb-audio-interface
https://www.sweetwater.com/store/detail/OnyxProducer22--mackie-onyx-producer-2-2-usb-audio-interface
192KHz sample rate with 24 bit depth. Now I've not tried these, but I assume (notice the word assume) this could work as a front-end for analyzer software. If they worked, it would be way ahead of a soundcard designed for playing music.
If anyone knows of an inexpensive external USB 192KHz sound card, please let us know.
There are also USB logging devices designed for all sorts of inputs. Most of these cost a significant amount.
I did find this:
https://www.analog.com/en/design-ce...oftware/evaluation-boards-kits/ADALM2000.html
It looks like a nifty toy that plays way more tricks than a simple DAC (In the $150 range). Still it's in the price range a real scope.
Seeing DC
Soundcards are all AC coupled (as far as I know). Meaning the soundcard won't see a DC voltage. Watch a signal strength meter and apply a DC voltage on an AC coupled sound card. The input will jump for a moment to reflect the change in state, then the signal meter will return to zero. The sensor could be putting out a DC voltage and we would never see it unless we picked up that first initial DC pulse. Real O-Scopes have DC coupling and can show a DC voltage. Most scopes have DC and AC both.
A second problem with AC coupling comes when measuring lights that use a Constant Current to control brightness. A constant DC offset is present usually with a higher frequency ripple sitting on top of it. With AC coupling the offset voltage is not seen or not seen very well.
For example a cheap Rayovac AA flashlight

The ripple is at 62.4KHz nobody is going to detect this with anything other than some sort of signal analyzer capable of seeing into the higher frequency range.

Is this worth doing?
A quality standalone O-Scope can be had for less than $300. If you always wanted one, here's one more reason to take the plunge.
There are far less expensive models. I found this on Amazon for less than $50. I have no idea if it is worth using. It's limited to 200KHz (little more than a good sound card) with a single channel. But it sure looks like it could serve the flashaholic in search of PWM. There are several similar scopes that seem to be the same product from different sellers.
https://www.amazon.com/dp/B07QML4LJL/?tag=cpf0b6-20
Then there are the pocket scopes like this one in the $100 range. Once again there are several flavors to choose from. These run up to 2MHz sampling.
https://www.amazon.com/dp/B00SXVUETU/?tag=cpf0b6-20
There are USB O-Scopes for around $100 or a bit less. After taking a long look at them, I think they are best left to those who know the limitations. Hantek is typical of this type of scope. It is DC coupled only.
http://www.hantek.com/en/ProductDetail_31.html
Because it is so cheap there are many sites devoted to mods and there are alternative software packages written by the EE and HAM communities. It gets mixed reviews, so be sure to get it someplace with a return policy – just in case.
Stepping up - the entry level PICO 2204A USB scope comes with a 5 year warranty and much better software for about $145. It is not nearly as capable as a quality standalone scope (for a hundred bucks or so more money). See:
https://www.picotech.com/
You can download the PICO scope software for free and play with it in demo mode with the built in signal generator. Find the software here:
https://www.picotech.com/downloads/_lightbox/picoscope-6
Sample Output

Getting The OS to see the soundcard.
In Windows 10 the setting was a little obstinate. I had to turn off the MIC input and turn on the Line input to get it going.

A plus here was allowing the speakers to monitor the signal.

I could hear the PWM singing and the volume gave me a clue as to how hard the card was being driven.
Also check the Advanced Settings.
You may already have a 192KHz card and the OS simply picks 44KHz or 48KHz by default.

Numbers to Measurement
Measuring PWM (at Last)
Most PWM occurs in the audio spectrum. I thought audio analyzer software might work for detecting PWM. I gave this a try first.
The software I used is RoomEQ Wizard (REW for short). This software works on most platforms. It requires Java. I've used this for years for speaker setup and equalization.
AND IT'S FREE. Find it here:
https://www.roomeqwizard.com/
If you are into audio and don't have this program for playing with speaker, equalizer, and room acoustics – well you're missing an incredible tool.
It has a little bit of a learning curve, but there are plenty of sites and videos dedicated to making it sing and dance.
I put it on an old PC running Linux. I didn't want to risk something newer in case I had an "Oh-No!" second and zapped the sound card.

I could have connected the PV cell directly to an audio cable, but I wanted a bit more flexibility if I wanted to try different sensors.
So…
I ripped the audio I/O off an old motherboard and got to the pinouts. I figured out what went where and added a connector from a dead amp so I could swap stuff out easier.

This is a shot of the office lights.
The horizontal scale is logarithmic frequency and the vertical scale is decibels (which is also logarithmic).

A strong peak at 120Hz from the overhead florescent lights with all sorts of harmonics running up the Freq. band.
Here is a shot with the lights off

PWM Measurements
Nitecore TUBE

Low

You can see a strong peak at 500Hz with harmonics out the wazoo running up the frequency band.
The harmonics indicate a square wave. A sine like wave would not have these.
Nitecore TUBE in Ramping

See the strong peak at 3KHz. When the TUBE ramps it changes PWM frequency. Once again the harmonics indicate a square wave.
Convoy S2+ Standard 3 mode driver.

Everyone has one of these
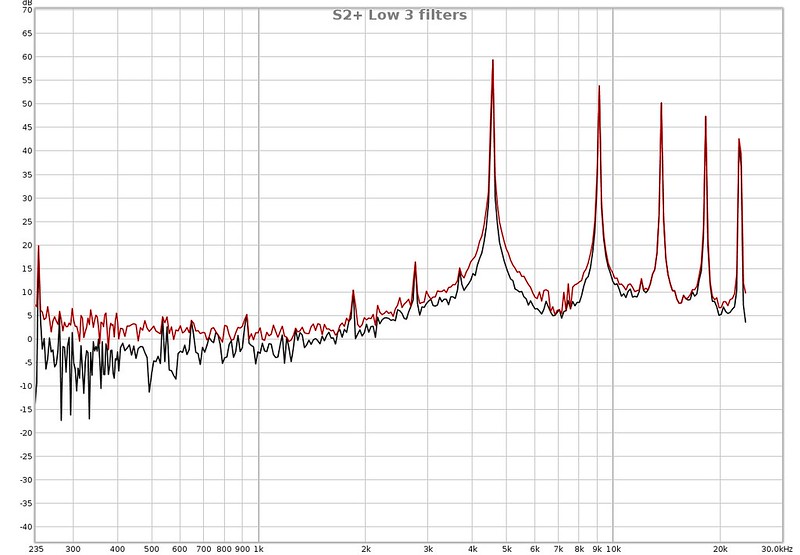
The main peak is at 4.5KHz.
How about something faster?
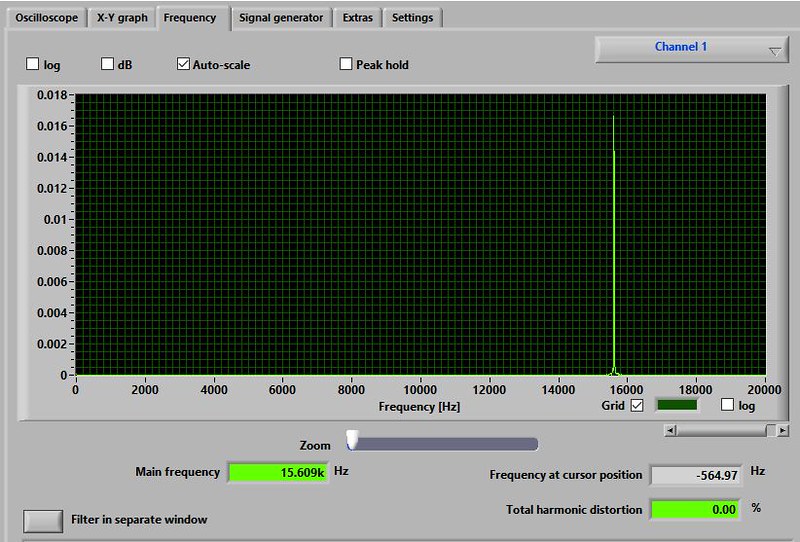
C8 with guppydrv
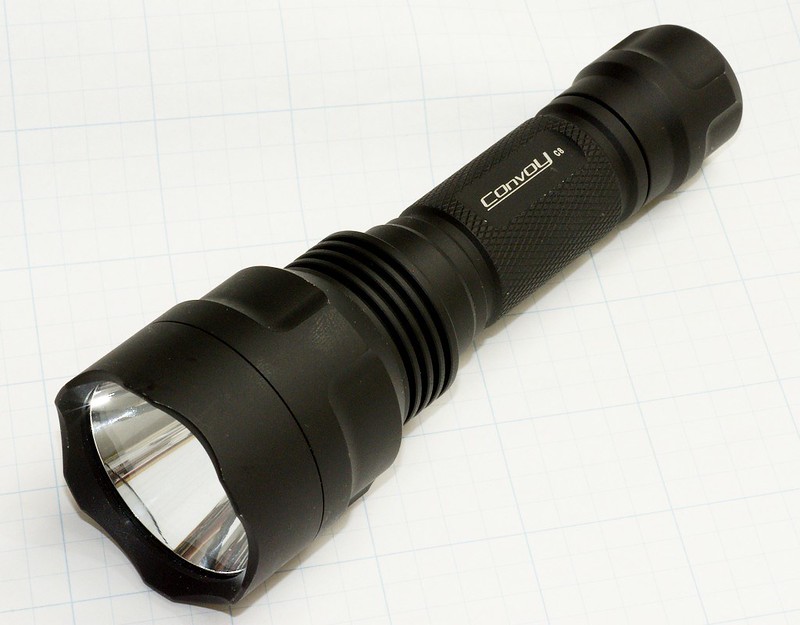
The frequency plot

16.5KHz, This Guppy/puppy is a soprano.
Many of us old farts can no longer hear that high.
Unless this was really loud, plugging this one into a speaker might not be recognized as having PWM.
I was not able to detect this PWM using other methods.
No amount of arm waving in photos or looking at fan blades showed me anything. At some point measuring is the only way.
Software Oscilloscopes
Audio software shows the frequency of the PWM but other than looking at the harmonics, little can be inferred about the waveform or duty cycle. Looking for sound card oscilloscope software turned up way more applications than I expected. I'll show off two of them.
The aptly named: Soundcard Oscilloscope
Available here:
https://www.zeitnitz.eu/scope_en
This is a free for home use application. I am using it on Windows 10 64Bit. The interface looks like a conventional standalone scope with knobs and buttons to change values. Seems to me there is a lot of wasted space that could be used for a larger display.

Here you can see the difference between a PV cell (top trace) and one of the diodes (bottom trace).
These are the lights in my office. Notice the fine details in the lower trace masked by the solar cell.
This software also has a frequency spectrum display.
Take a look at a Rayovac AAA Headlight. The main peak is at 234Hz. Not the most impressive PWM to be sure.

The Frequency display can be linear both in scale and amplitude. Better, I think, that the log scales seen in the audio software.
The nice thing about this software is it's easy to use. Just fiddle with the settings till you get something useful on the screen. The trigger seems stable. The software has features that go above and beyond what I use for looking at PWM. It gives you a taste of what having a real O-scope would be like
One thing I found lacking was the absence of an invert option (or at least I couldn't find it). It seems my soundcards invert the signal so that what I was seeing was bassackwards from what it should be. I got around this by reversing the sensor inputs.
On this package there is not (or I can't find) any way to make the traces bolder. That would be really helpful for screen captures.
The software has a screen capture feature. I found I got a better shot by stopping the capture and using Window Snipping Tool to grab the image.
Here's a blast from the past.
Remember the EternaLight?

Here is the EternaLight PWM sitting underneath the 120Hz near sine wave of my office lights.

The Nitecore TUBE again.

The Duty Cycle is easy to estimate.

And the 3KHz PWM is seen on the Frequency Window
I also used it to measure a Strobe mode running about 13Hz.

I much prefer the Frequency screen on this one verses the package below.
But…. The software settings only allowed for a 44K setting on the sound card even though I was using a 192K card. The option is grayed out. This limits measurements to 22KHz. This is a real limitation to this easy to use package.
As the PWM approaches the upper limit, the waveform loses definition.

BLF Q8

Not easy to see what's going on, but better than just a counter number.
Still the Frequency plot shows the 15.6KHz PWM
Visual Analyzer
Available here:
http://www.sillanumsoft.org/
It's free for home use. I'm using it in Window 10-64Bit.
This one can make use of the 192KHz sample rate of the sound card.
So far it's the best application I've tested for this sort of thing.
It's is a bit more complicated to get setup properly. Look under the settings tab and set the various options. The package crashes sometimes if I try to save some configurations.
There is an installable version and a standalone version that runs from an .exe file. That's kind of a nice option.
Try it on different systems without having to install it.
Once again the lights in my office.
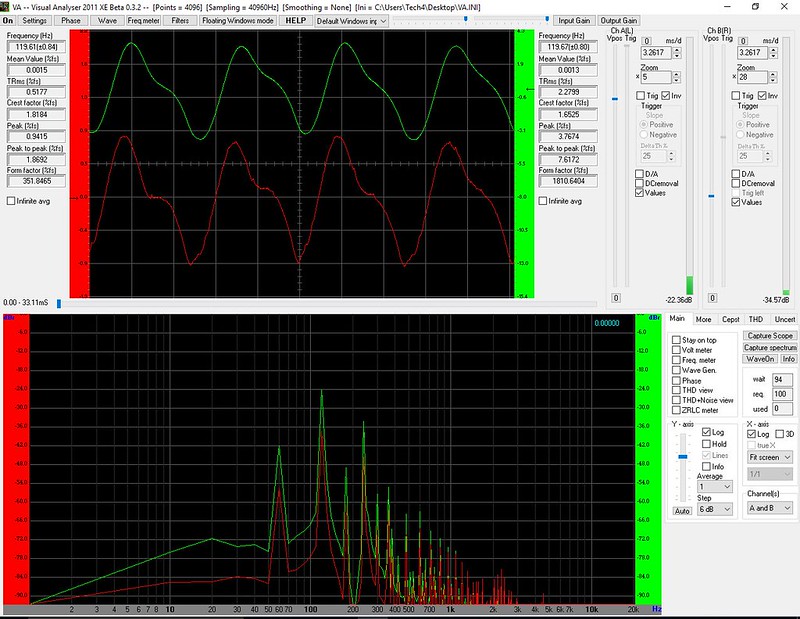
Holy Fast Fourier transform Batman. This is all sorts of stuff to see. The UI is designed for GUI instead of mimicking an analogue scope. The main screen has the O-scope view sitting above a frequency spectrum. This package takes more fussing to get things adjusted. There is way more here in the way of signal analyses than I have a clue about using.
For some reason I don't seem to be able to set the timings for divisions that make sense. Like even numbers?! The timings are related to the total pixel width of the application window. I have to resize the window to get an even number in the time scale. Most annoying!
This one has invert options so I didn't need to flip my inputs.
I did seem to have more trouble getting a good trigger with this software. Signals that were easy to sync on the previous software I had trouble catching with Visual Analyzer. Still just stopping the capture freezes the screen and that worked for me. This software has the ability to make the traces bolder which makes a screen capture easier to see.
The screen capture is very sophisticated. It's not just a picture of the output. There are adjustments that can be made in the capture screen – screen. There are separate captures for the O-scope and the Frequency display as well as a bunch of other things beyond my pay grade.
Clicking a few buttons gets us even more information

Once again I stopped the capture and used the Window Snipping Tool to grab the whole thing.
Green trace – Office Lights, Red Trace Convoy S2+.
It looks like there is some cross talk going on. I might have not had the sensors isolated properly (or there is some cross talk).
Step up to 192KHz
I had a motherboard with a 192K card on board so I had to give it a try to see what additional information could be gained over a 48K card.
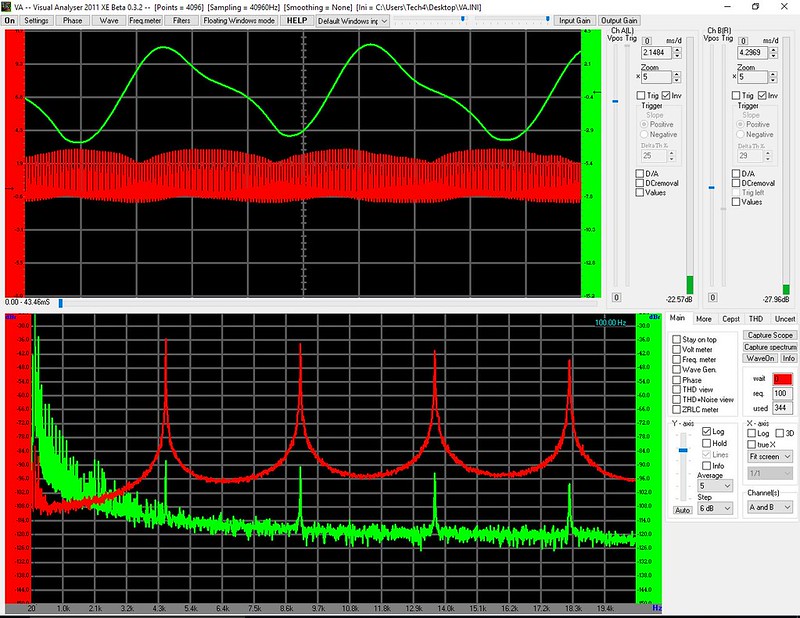
Here are a set of examples with increasing sampling rate to illustrate the need for a sufficient number of samples to define a waveform.
Nitecore TUBE at 3KHz running about 66% Duty Cycle.
11KHz

What is it? A triangle wave?
22KHz

Looks more like a sine wave here.
48KHz

So it is a square wave after all
96KHz

A square wave with a Duty Cycle
192KHz

This looks pretty good to me.
25MHz BK Oscilloscope.

The Duty Cycle may be a bit different than the one above. I think I turned off the light when I swapped scopes.
Taking a look at the whole screen shows the wave form and the frequency plot
In addition the software has a frequency counter that makes measuring the PWM frequency easy.
Sometimes the counter has problems locking onto a frequency for some reason.
In this example the Duty Cycle is much lower.

How about something faster?

Convoy S2+ on low.

It's easy to see it runs a low Duty Cycle.
Here's a Convoy on Medium

Showing a longer Duty Cycle
Let's keep going.
The Rayovac AA on low.
PWM 12.4KHz - Showing a lower Duty Cycle.
The same light zoomed in on a 25MHz scope
The double hump at the top of the wave is lost on the 192KHz sound card.
The BLF Q8.

A much better look at the PWM waveform compared to the Sound Card Oscilloscope software.
Using the measuring tools the off and on parts of the Duty Cycle can be measured and the Duty Cycle calculated.
You can see the harmonics running up to the 96KHz limit. Those were missing on the previous software.
Taking a look the same Q8 on a real scope and zooming in on the waveform shows:

The double hump on the top of the square wave is masked by the 192KHz sample rate.
This double hump is found on many lights running in regulated mode.
When the light switches into unregulated mode the PWM becomes a square wave sitting on a DC offset.
Sofirn SP70.
My fastest PWM light so far.
PWM 19.9KHz.
A lower Duty Cycle. I should have expanded the time scale to get a better look.

Sofirn SP70 on Turbo
PWM of 19.9KHZ with a 90+% Duty Cycle.
I drew an approximate waveform in red above the trace.

It's getting harder to see what's going on in the wave form. Still the software yields a useful frequency count and some information about the Duty Cycle.
Rayovac AA on High
PWM 62.4KHz?
No, this is an example of a light running a DC offset with a ripple sitting on top of the DC voltage.
The ripple is caused (I think) by the boost circuit.
Devices with slower sample rates would just show this as noise.
Stopping the screen capture and moving the curser allow measurements of the waveform.
What is Bad PWM?
For me, the length of time a light spends in the off part of the Duty Cycle is the key to determining if a light has a tolerable PWM.

The Rayovac AAA headlamp on high has a 234Hz PWM with a 50% duty cycle.

I can clearly see that the light has PWM. It is OK to work with as long as there is some additional light available. Working indoors, with the lights on, it is no problem. For example - messing with the wires behind the AV rig. In true dark it is less pleasant but not too bad.
On low the PWM drops to 188Hz. With about a 20% Duty Cycle.

The PWM is very noticeable. Using it indoors, even with the room lights helping even things out, it is not pleasant. In true dark, not fun at all.
Notice the peak at the start of the square wave. The voltage jumps higher than is indicated in the 192KHz information. I think this quick flash also contributes to the perception of crappy PWM.
Conclusion
It is possible to use readily available parts to make a rig that allows testing lights for PWM in the audio range
Using a 192KHz card PWM can be measured into the 90KHz range.
Unfortunately for me testing lights is just as addictive as buying them.
After doing these tests I found a deal on a demo model 25MHz PICO scope.
Now I need a calibrated light box of some sort and a spectrometer and….
And if you made it this far…
What do you think about a thread that just measures PWM and Duty Cycle?
I think it would be interesting to see what lights others find with good or bad PWM.
Perhaps some sort of minimum criteria could be established.
All the Best,
Jeff
================================================================
Here is a link to an article about using a soundcard with a fancier front-end:
http://www.epanorama.net/newepa/2012/05/08/usb-soundcard-to-digital-storage-oscilloscope/
PWM 10% Duty Cycle
PWM 80% Duty Cycle
Pulse Wave Modulation (PWM) is a commonly used method to control the brightness of LED lights.
This Sticky goes into detail on PWM.
https://www.candlepowerforums.com/v...t-is-it-How-does-it-work-and-how-to-detect-it
Lights with poor PWM are a real problem if used for any length of time. For finding dropped car keys it's no big deal. Using a light with noticeable PWM for any length of time leads to eyestrain and headaches in fairly short order.
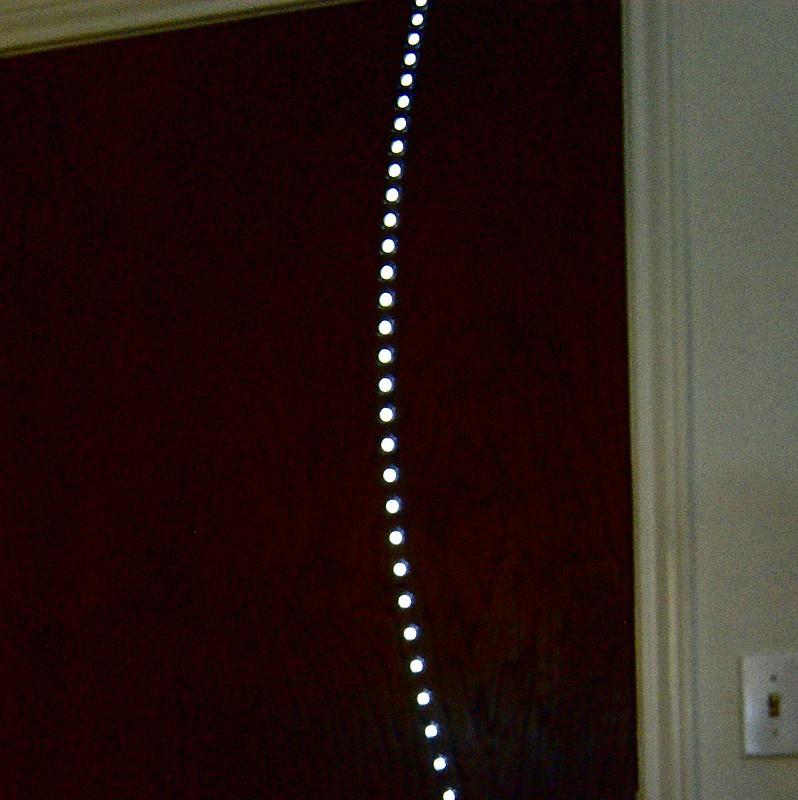
Detecting low frequency PWM is as easy as waving something in front of the light (the Finger Wave). Lights with poor PWM characteristics look like an old time movie or a series of stop motion photos.
Waving the light quickly and taking a photo shows lights with a faster PWM – up to a point.
PWM at 500Hz is easy to see
Lights with fast PWM are hard to distinguish from lights running a constant voltage.
PWM at 16KHz – I can't detect anything.
To find out if a light is using a fast PWM some sort of detection device is needed.
I got interested in PWM because I bought some lights with just plain crappy PWM.
I have an old oscilloscope but it is a pain to use and an even bigger pain to capture a photo of the PWM wave. Finding out the PWM frequency requires measuring the trace on the screen and plugging the value into a formula. Getting a duty cycle involves more of the same.
This got me interested in seeing just what a hobbyist could cobble together to measure PWM frequencies using free or very low cost equipment.
There are three things needed (well two if using a Multimeter with a Frequency Counter).
First convert light into volts.
Next sample the analogue voltage and convert it to numbers (digitizing)
Finally use something to analyze the result and present it in a useful manner.
I tested three free software applications to measure PWM.
The third software package proved the most useful for testing PWM.
Jump down to the heading: Visual Analyzer to skip all the steps leading up to using that software.
Actually there is a fourth important step. Making sure the voltage source does not kill the digital to analogue converter (the computers sound card).
Over in the BLF there is a lengthy POST from ToyKeeper about seeing/detecting PWM by using a photo and other methods.
http://budgetlightforum.com/node/67041
The CPF Sticky thread mentioned above is a good place to start understanding what PWM is all about and different methods to see if a light is using PWM.
First convert Photons to Volts.
I had a cheap PV cell that I got somewhere for about $3. Other sources are solar calculators or any of the thousands of cheap solar rechargeable thingies that seem to be everywhere. Smaller is better in this case.
Lights – Volts - Counting
If you have a DMM with a frequency function, this maybe all you need. Start in a dark room. Hook the PV cell to the meter. Shine a light with a known PWM at the ceiling and see if you can get a reading. If not try bringing the light closer to the PV cell and see if that gets you a freq. count.
You might need to put some resistance (1K to 10K Ohms) in parallel with the PV cell to cut down on the DC offset.
This does not work with all DMMs with Frequency counters for some reason.
My old Fluke meters don't have a Frequency function. So I went looking for another method.
Lights – Volts - Sound
Another way to detect PWM is with your ears. Hook a PV cell to an old powered computer speaker.
Here is an example:
https://www.candlepowerforums.com/v...-How-does-it-work-and-how-to-detect-it/page11 POST 309
Lights – Volts
Converting photons to volts is fairly easy. A Solar Cell (PV Cell) ripped out of any sort of cheap solar powered device should be easy to find. If not they sell for a buck or two on eBay. Bigger is not better. A small cell works just fine.
PV cells will put out a DC voltage. That's something that needs to be limited to protect the A to D device (the sound card). Running a resistor in parallel with the PV cell output will do this nicely. The amount of resistance needed depends on the PV Cell and how bright the light is. I found 200 Ohms to 5K Ohms worked for me.
Hook the PV cell and the resistor to a DMM and measure the output voltage in room lighting and in the dark with various lights bounced off the ceiling or shining on the PV cell. Make a note of the voltages.
Volts from Office Lights
Volts from a 400 Lumen light
Controlling the Brightness
A light on Moonlight setting is about a zillion times dimmer that the supernova Turbo setting. This makes getting a good output signal from the sensor hard to do. I initially used a series of filters to control brightness.
This proved to be more trouble in the long run. Pointing the light away from the sensor and bringing it closer if more signal was needed proved to the easiest way.
Use the Voltmeter to get an idea of what the output of the PV circuit is depending on the way the light hits the cell. This will be used in deciding how to deal with the sound card input.
An LED can be used as a sensor. Yes – they work backwards (much like me). Once again use a voltmeter to test the output and match that to the sound cards input.
LEDs used as sensors have problems with dim lights. Catching a signal from moonlight mode is tough. See the BLF thread from Terry mentioned below for tests of LEDs used as sensors (LEDs as sensors are tested on the second and third page).
The other alternative is to use a photo diode in a simple circuit. The advantage of a photo diode is a much faster response time to get a better look at the waveform. Using the proper source voltage or a correct resistor value will limit the possibility of overdriving the computers sound card.
After reading the excellent review of various diodes (etc.) for measuring PWM by Terry Oregon:
http://budgetlightforum.com/node/61254
I decided to see if I could get hold of the OSRAM BPW34
I found this on Amazon
https://www.amazon.com/dp/B00B88FFDA/?tag=cpf0b6-20
5 of them for less than $11 (when I bought mine) for a BPW34. No need to wait for China, hopefully they would be similar to the one tested.
The envelope arrived and I thought it was empty. Inside was a second envelope with the BPW34(s). No documentation at all.
Geeze these things are small! Thanks to Terrys' post – I know the negative side is one to the right in the photo. It has a bar and dot.
I built this setup to convert Photons to Volts
I used a tube to hold the sensor (diode), a battery holder for a 16850, and a spot to hook the scope across the resistor array. Hot glue holds it all together. The battery is connected in series with the diode and the resistor(s).
A lid for the tube held the light and filters to control brightness.
I started off using (5) 10K resistors. This provided a good voltage even with very low light levels. After some experimenting I eventually arrived at using a 2.5K Ohm resistor in series with the negative side of the photo diode.
The lower the resistance, the faster the diode will respond to voltage changes. The better photo diodes are much better than PV cells or LEDs connected as a sensor.
A light with a very Low duty cycle PWM.
Photo diode vs PV cell.
PV Cell (no resistance added) on the top - Photo diode on the bottom.
And the winner is the Diode for a faster response.
At first I used a series of filters to limit brightness. Too much light and the signal would start to clip and give a false reading. I used really high tech filters. I chopped them out of those dark film thingies you get from the eye doctor.
I later made the tube longer and laid it horizontally. That way I could keep the overhead lights on and not shine them on sensor. The brightness is controlled by shining more of less of the beam into the tube.
Limiting Voltage
I used the PV cell in my first experiments. Later I built the diode sensor mentioned above.
The important thing to remember is that you are plugging a voltage source directly into your PC sound card. Push too many volts at it and PUFF – the magic smoke gets out and you kill the card.
I suggest using an external USB sound card. That will protect the motherboards internal card from OH!-NO! Seconds. Sound card input voltages are in the order of 50mV for Mic inputs or 1.5v for line inputs. Some (note the word some) Mic inputs can handle line level signals. This is controlled in the soundcard properties.
Use a volt meter to measure the output of your sensor. Plan accordingly. The total voltage can be limited by making sure not to shine the light directly on the sensor. Limiting the source voltage in the diode sensor circuit is another way to keep things safe.
Using a 1.2 volt battery as the power supply puts one of these circuits within or very near the safe limits of a LINE Level soundcard. Using a higher voltage battery for supply power requires limiting the sample voltage.
Using a pair of diodes in opposition across the sensor output will limit the voltage. Above .7V or so the signal will clip. Use 4 diodes, two in series, in parallel with a second pair (oriented in the opposite direction) will bump the limit to 1.4V or so. A 1N4148 is really cheap and works.
Building a simple resistor circuit will divide the voltage into something safe. To do it correctly the input impedance on the soundcard needs to be known and plugged into a formula.
Who knows that? Instead just arrive at the value by trial and error.
Here is a shot of my setup with a bunch of 10K resistors in series.
Just measure the voltage across the output with the sensor bypassed to check the max voltage.
At the end of the POST I'll leave links to an article about different front ends for sound cards.
It makes a lot of sense to use an external soundcard to prevent the built-in one from getting smoked. Many users are getting satisfactory results with an ultra cheap card like this one.
https://www.dx.com/p/usb-virtual-7-1-channel-external-sound-card-adapter-2009693
or
https://www.dx.com/p/external-5-1-c...ical-audio-adapter-black-2008145#.XU3IDG5Fyck
Given a choice, finding something that lists a LINE level input is preferable to a MIC only input. But it seems these cheap cards with a MIC input are being used with good results.
Converting Volts to Numbers
Everyone with a computer has an Analog to Digital converter - the sound card. The problem is that soundcard are, well, soundcards. They are mostly designed for output. They convert digital signals (music) into analog (voltages) to plug into an external sound system (5.1 or 7.1 outputs). At most they will have a 2 channel LINE input and a 2 channel (or sometimes mono) MIC input.
Using the soundcard as an input has its limits (literally)
First is the frequency. Most soundcards have a 48KHz sample rate limiting bandwidth to 24KHz. As the signal approaches the upper Freq. limits, the number of samples covering the wavelet gets smaller. As such the rendition of a complex wave is distorted. A 48KHz card has real problems looking at a 16.5KHz wave. There are just not enough samples to work with. Google Nyquist for more info.
However the frequency can still be measured accurately as it approaches the bandwidth limit.
There are 192KHz sound cards. ASUS and Creative make internal ones that sell for $40.
External 192K cards are pushing $100 or more.
Unless you have use another use for a high resolution sound card, it makes no sense to spend that kind of money on an external card. A cheap oscilloscope can be had in the same price range.
There are sound cards that are more suitable if you look on the music biz side of things.
https://www.sweetwater.com/store/detail/UMC202HD--behringer-u-phoria-umc202hd-usb-audio-interface
https://www.sweetwater.com/store/detail/OnyxProducer22--mackie-onyx-producer-2-2-usb-audio-interface
192KHz sample rate with 24 bit depth. Now I've not tried these, but I assume (notice the word assume) this could work as a front-end for analyzer software. If they worked, it would be way ahead of a soundcard designed for playing music.
If anyone knows of an inexpensive external USB 192KHz sound card, please let us know.
There are also USB logging devices designed for all sorts of inputs. Most of these cost a significant amount.
I did find this:
https://www.analog.com/en/design-ce...oftware/evaluation-boards-kits/ADALM2000.html
It looks like a nifty toy that plays way more tricks than a simple DAC (In the $150 range). Still it's in the price range a real scope.
Seeing DC
Soundcards are all AC coupled (as far as I know). Meaning the soundcard won't see a DC voltage. Watch a signal strength meter and apply a DC voltage on an AC coupled sound card. The input will jump for a moment to reflect the change in state, then the signal meter will return to zero. The sensor could be putting out a DC voltage and we would never see it unless we picked up that first initial DC pulse. Real O-Scopes have DC coupling and can show a DC voltage. Most scopes have DC and AC both.
A second problem with AC coupling comes when measuring lights that use a Constant Current to control brightness. A constant DC offset is present usually with a higher frequency ripple sitting on top of it. With AC coupling the offset voltage is not seen or not seen very well.
For example a cheap Rayovac AA flashlight
The ripple is at 62.4KHz nobody is going to detect this with anything other than some sort of signal analyzer capable of seeing into the higher frequency range.
Is this worth doing?
A quality standalone O-Scope can be had for less than $300. If you always wanted one, here's one more reason to take the plunge.
There are far less expensive models. I found this on Amazon for less than $50. I have no idea if it is worth using. It's limited to 200KHz (little more than a good sound card) with a single channel. But it sure looks like it could serve the flashaholic in search of PWM. There are several similar scopes that seem to be the same product from different sellers.
https://www.amazon.com/dp/B07QML4LJL/?tag=cpf0b6-20
Then there are the pocket scopes like this one in the $100 range. Once again there are several flavors to choose from. These run up to 2MHz sampling.
https://www.amazon.com/dp/B00SXVUETU/?tag=cpf0b6-20
There are USB O-Scopes for around $100 or a bit less. After taking a long look at them, I think they are best left to those who know the limitations. Hantek is typical of this type of scope. It is DC coupled only.
http://www.hantek.com/en/ProductDetail_31.html
Because it is so cheap there are many sites devoted to mods and there are alternative software packages written by the EE and HAM communities. It gets mixed reviews, so be sure to get it someplace with a return policy – just in case.
Stepping up - the entry level PICO 2204A USB scope comes with a 5 year warranty and much better software for about $145. It is not nearly as capable as a quality standalone scope (for a hundred bucks or so more money). See:
https://www.picotech.com/
You can download the PICO scope software for free and play with it in demo mode with the built in signal generator. Find the software here:
https://www.picotech.com/downloads/_lightbox/picoscope-6
Sample Output
Getting The OS to see the soundcard.
In Windows 10 the setting was a little obstinate. I had to turn off the MIC input and turn on the Line input to get it going.
A plus here was allowing the speakers to monitor the signal.
I could hear the PWM singing and the volume gave me a clue as to how hard the card was being driven.
Also check the Advanced Settings.
You may already have a 192KHz card and the OS simply picks 44KHz or 48KHz by default.
Numbers to Measurement
Measuring PWM (at Last)
Most PWM occurs in the audio spectrum. I thought audio analyzer software might work for detecting PWM. I gave this a try first.
The software I used is RoomEQ Wizard (REW for short). This software works on most platforms. It requires Java. I've used this for years for speaker setup and equalization.
AND IT'S FREE. Find it here:
https://www.roomeqwizard.com/
If you are into audio and don't have this program for playing with speaker, equalizer, and room acoustics – well you're missing an incredible tool.
It has a little bit of a learning curve, but there are plenty of sites and videos dedicated to making it sing and dance.
I put it on an old PC running Linux. I didn't want to risk something newer in case I had an "Oh-No!" second and zapped the sound card.
I could have connected the PV cell directly to an audio cable, but I wanted a bit more flexibility if I wanted to try different sensors.
So…
I ripped the audio I/O off an old motherboard and got to the pinouts. I figured out what went where and added a connector from a dead amp so I could swap stuff out easier.
This is a shot of the office lights.
The horizontal scale is logarithmic frequency and the vertical scale is decibels (which is also logarithmic).
A strong peak at 120Hz from the overhead florescent lights with all sorts of harmonics running up the Freq. band.
Here is a shot with the lights off
PWM Measurements
Nitecore TUBE
Low
You can see a strong peak at 500Hz with harmonics out the wazoo running up the frequency band.
The harmonics indicate a square wave. A sine like wave would not have these.
Nitecore TUBE in Ramping
See the strong peak at 3KHz. When the TUBE ramps it changes PWM frequency. Once again the harmonics indicate a square wave.
Convoy S2+ Standard 3 mode driver.
Everyone has one of these
The main peak is at 4.5KHz.
How about something faster?
C8 with guppydrv
The frequency plot
16.5KHz, This Guppy/puppy is a soprano.
Many of us old farts can no longer hear that high.
Unless this was really loud, plugging this one into a speaker might not be recognized as having PWM.
I was not able to detect this PWM using other methods.
No amount of arm waving in photos or looking at fan blades showed me anything. At some point measuring is the only way.
Software Oscilloscopes
Audio software shows the frequency of the PWM but other than looking at the harmonics, little can be inferred about the waveform or duty cycle. Looking for sound card oscilloscope software turned up way more applications than I expected. I'll show off two of them.
The aptly named: Soundcard Oscilloscope
Available here:
https://www.zeitnitz.eu/scope_en
This is a free for home use application. I am using it on Windows 10 64Bit. The interface looks like a conventional standalone scope with knobs and buttons to change values. Seems to me there is a lot of wasted space that could be used for a larger display.
Here you can see the difference between a PV cell (top trace) and one of the diodes (bottom trace).
These are the lights in my office. Notice the fine details in the lower trace masked by the solar cell.
This software also has a frequency spectrum display.
Take a look at a Rayovac AAA Headlight. The main peak is at 234Hz. Not the most impressive PWM to be sure.
The Frequency display can be linear both in scale and amplitude. Better, I think, that the log scales seen in the audio software.
The nice thing about this software is it's easy to use. Just fiddle with the settings till you get something useful on the screen. The trigger seems stable. The software has features that go above and beyond what I use for looking at PWM. It gives you a taste of what having a real O-scope would be like
One thing I found lacking was the absence of an invert option (or at least I couldn't find it). It seems my soundcards invert the signal so that what I was seeing was bassackwards from what it should be. I got around this by reversing the sensor inputs.
On this package there is not (or I can't find) any way to make the traces bolder. That would be really helpful for screen captures.
The software has a screen capture feature. I found I got a better shot by stopping the capture and using Window Snipping Tool to grab the image.
Here's a blast from the past.
Remember the EternaLight?
Here is the EternaLight PWM sitting underneath the 120Hz near sine wave of my office lights.
The Nitecore TUBE again.
The Duty Cycle is easy to estimate.
And the 3KHz PWM is seen on the Frequency Window
I also used it to measure a Strobe mode running about 13Hz.
I much prefer the Frequency screen on this one verses the package below.
But…. The software settings only allowed for a 44K setting on the sound card even though I was using a 192K card. The option is grayed out. This limits measurements to 22KHz. This is a real limitation to this easy to use package.
As the PWM approaches the upper limit, the waveform loses definition.
BLF Q8
Not easy to see what's going on, but better than just a counter number.
Still the Frequency plot shows the 15.6KHz PWM
Visual Analyzer
Available here:
http://www.sillanumsoft.org/
This one can make use of the 192KHz sample rate of the sound card.
So far it's the best application I've tested for this sort of thing.
It's is a bit more complicated to get setup properly. Look under the settings tab and set the various options. The package crashes sometimes if I try to save some configurations.
There is an installable version and a standalone version that runs from an .exe file. That's kind of a nice option.
Try it on different systems without having to install it.
Once again the lights in my office.
Holy Fast Fourier transform Batman. This is all sorts of stuff to see. The UI is designed for GUI instead of mimicking an analogue scope. The main screen has the O-scope view sitting above a frequency spectrum. This package takes more fussing to get things adjusted. There is way more here in the way of signal analyses than I have a clue about using.
For some reason I don't seem to be able to set the timings for divisions that make sense. Like even numbers?! The timings are related to the total pixel width of the application window. I have to resize the window to get an even number in the time scale. Most annoying!
This one has invert options so I didn't need to flip my inputs.
I did seem to have more trouble getting a good trigger with this software. Signals that were easy to sync on the previous software I had trouble catching with Visual Analyzer. Still just stopping the capture freezes the screen and that worked for me. This software has the ability to make the traces bolder which makes a screen capture easier to see.
The screen capture is very sophisticated. It's not just a picture of the output. There are adjustments that can be made in the capture screen – screen. There are separate captures for the O-scope and the Frequency display as well as a bunch of other things beyond my pay grade.
Clicking a few buttons gets us even more information
Once again I stopped the capture and used the Window Snipping Tool to grab the whole thing.
Green trace – Office Lights, Red Trace Convoy S2+.
It looks like there is some cross talk going on. I might have not had the sensors isolated properly (or there is some cross talk).
Step up to 192KHz
I had a motherboard with a 192K card on board so I had to give it a try to see what additional information could be gained over a 48K card.
Here are a set of examples with increasing sampling rate to illustrate the need for a sufficient number of samples to define a waveform.
Nitecore TUBE at 3KHz running about 66% Duty Cycle.
11KHz
What is it? A triangle wave?
22KHz
Looks more like a sine wave here.
48KHz
So it is a square wave after all
96KHz
A square wave with a Duty Cycle
192KHz
This looks pretty good to me.
25MHz BK Oscilloscope.
The Duty Cycle may be a bit different than the one above. I think I turned off the light when I swapped scopes.
Taking a look at the whole screen shows the wave form and the frequency plot
In addition the software has a frequency counter that makes measuring the PWM frequency easy.
Sometimes the counter has problems locking onto a frequency for some reason.
In this example the Duty Cycle is much lower.
How about something faster?
Convoy S2+ on low.
It's easy to see it runs a low Duty Cycle.
Here's a Convoy on Medium
Showing a longer Duty Cycle
Let's keep going.
The Rayovac AA on low.
PWM 12.4KHz - Showing a lower Duty Cycle.
The same light zoomed in on a 25MHz scope
The double hump at the top of the wave is lost on the 192KHz sound card.
The BLF Q8.
A much better look at the PWM waveform compared to the Sound Card Oscilloscope software.
Using the measuring tools the off and on parts of the Duty Cycle can be measured and the Duty Cycle calculated.
You can see the harmonics running up to the 96KHz limit. Those were missing on the previous software.
Taking a look the same Q8 on a real scope and zooming in on the waveform shows:
The double hump on the top of the square wave is masked by the 192KHz sample rate.
This double hump is found on many lights running in regulated mode.
When the light switches into unregulated mode the PWM becomes a square wave sitting on a DC offset.
Sofirn SP70.
My fastest PWM light so far.
PWM 19.9KHz.
A lower Duty Cycle. I should have expanded the time scale to get a better look.
Sofirn SP70 on Turbo
PWM of 19.9KHZ with a 90+% Duty Cycle.
I drew an approximate waveform in red above the trace.
It's getting harder to see what's going on in the wave form. Still the software yields a useful frequency count and some information about the Duty Cycle.
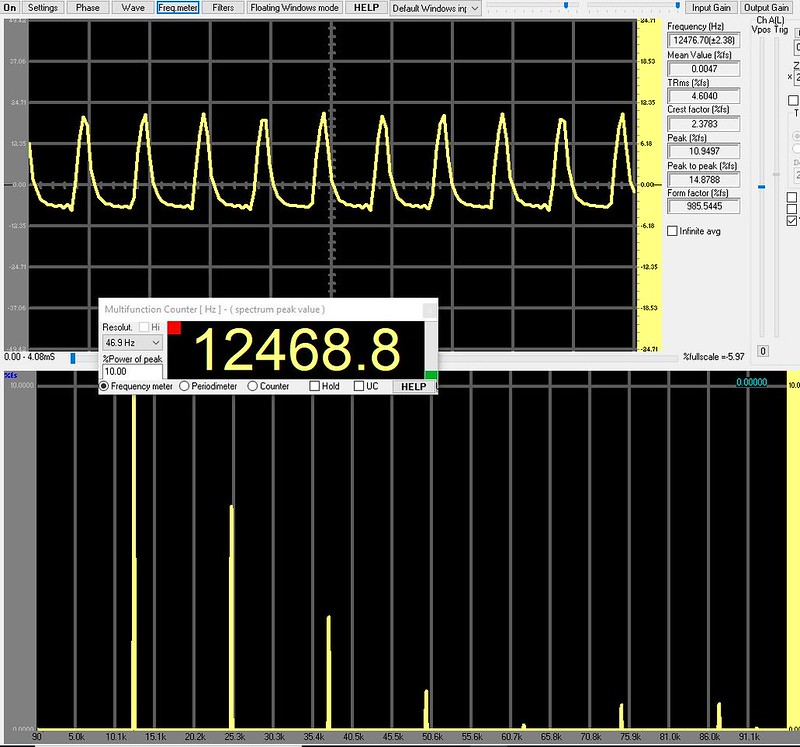
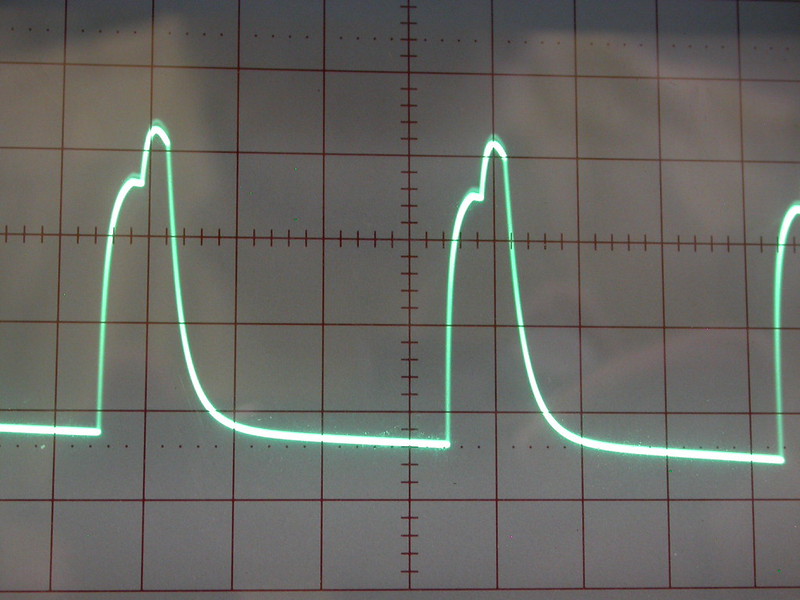
Rayovac AA on High
PWM 62.4KHz?
No, this is an example of a light running a DC offset with a ripple sitting on top of the DC voltage.
The ripple is caused (I think) by the boost circuit.
Devices with slower sample rates would just show this as noise.
Stopping the screen capture and moving the curser allow measurements of the waveform.
What is Bad PWM?
For me, the length of time a light spends in the off part of the Duty Cycle is the key to determining if a light has a tolerable PWM.
The Rayovac AAA headlamp on high has a 234Hz PWM with a 50% duty cycle.
I can clearly see that the light has PWM. It is OK to work with as long as there is some additional light available. Working indoors, with the lights on, it is no problem. For example - messing with the wires behind the AV rig. In true dark it is less pleasant but not too bad.
On low the PWM drops to 188Hz. With about a 20% Duty Cycle.
The PWM is very noticeable. Using it indoors, even with the room lights helping even things out, it is not pleasant. In true dark, not fun at all.
Notice the peak at the start of the square wave. The voltage jumps higher than is indicated in the 192KHz information. I think this quick flash also contributes to the perception of crappy PWM.
Conclusion
It is possible to use readily available parts to make a rig that allows testing lights for PWM in the audio range
Using a 192KHz card PWM can be measured into the 90KHz range.
Unfortunately for me testing lights is just as addictive as buying them.
After doing these tests I found a deal on a demo model 25MHz PICO scope.
Now I need a calibrated light box of some sort and a spectrometer and….
And if you made it this far…
What do you think about a thread that just measures PWM and Duty Cycle?
I think it would be interesting to see what lights others find with good or bad PWM.
Perhaps some sort of minimum criteria could be established.
All the Best,
Jeff
================================================================
Here is a link to an article about using a soundcard with a fancier front-end:
http://www.epanorama.net/newepa/2012/05/08/usb-soundcard-to-digital-storage-oscilloscope/
Last edited:
