4sevens
Flashlight Enthusiast
Hey everybody - I've had a couple of these Olight SR90's for testing since the Shot show and people have been asking us about them so I decided to do some runtime graphs. I only have data for high right now. I'm gathering data for medium as we speak.
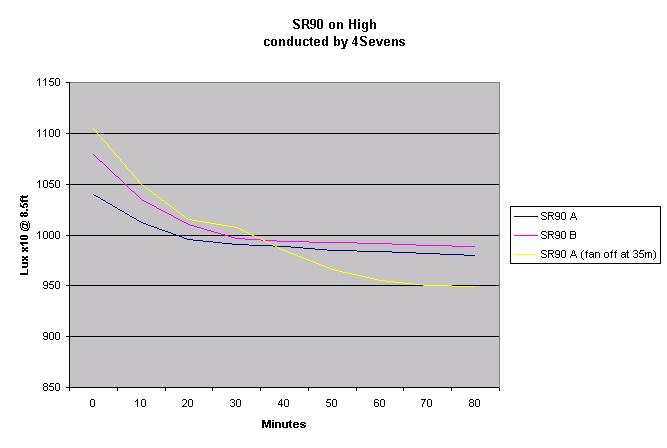
The Y axis is the actual lux readings x10 at 8.5 feet away.
Note that I cut off the fan 35 minutes into the third run (yellow)

The Y axis is the actual lux readings x10 at 8.5 feet away.
Note that I cut off the fan 35 minutes into the third run (yellow)
Last edited: