Battery Guy
Enlightened
Greetings Everyone,
I have been doing a lot of performance tests on AA NiMH cells recently and posting the results in various threads. I thought that it might be nice to put these results all in one place and update it as more come in.
I hope that this data set will be a nice complement to the comprehensive and exhaustive testing that Silverfox has performed in his NiMH Shootout.
My purpose here is to provide a bit more detailed test results on the more popular NiMH batteries.
Test Setup
All cells are discharged on a Maccor series 4300 battery tester. Nickel tab strips are spot welded to each cell to minimize contact resistance. Unless otherwise noted, cells are discharged to a 0.8 V cut-off. All cells were purchased new and tested within a few weeks of receipt. With the exception of the Elite 1700s and Shnoopaloops, all cells were tested fresh out of the package. The Elite 1700s and Shoopaloops went through one break-in cycle on a Maha C9000 prior to testing. Cells are charged at a 1C rate with a 10 mV -dV cut-off, then allowed to rest for 1 hour prior to discharging.
Limitations
One cell is hardly what I would call a statistically significant sample. There is certainly going to be variability in cell performance, so please recognize this limitation. Unfortunately, I do not have the time to repeat this work on multiple samples. Also, this testing does not take into account performance degradation that occurs over time due to aging and cycling (except for the Shnoopaloop constant current tests). These results are what you might expect for new cells. Exactly how the cells degrade will depend on the cell design, manufacturing quality and your use/abuse pattern.
In other words, your mileage may vary.
Constant Current Discharge Results
Constant current discharge is very close to what a battery sees in an incan hotwire flashlight. For these types of unregulated lights, you really want to know what the voltage of the cell is under load so that you can match it to the bulb output. I hope that these curves serve to compliment the excellent tests that LuxLuthor performed on incan bulbs, the results of which are posted here.
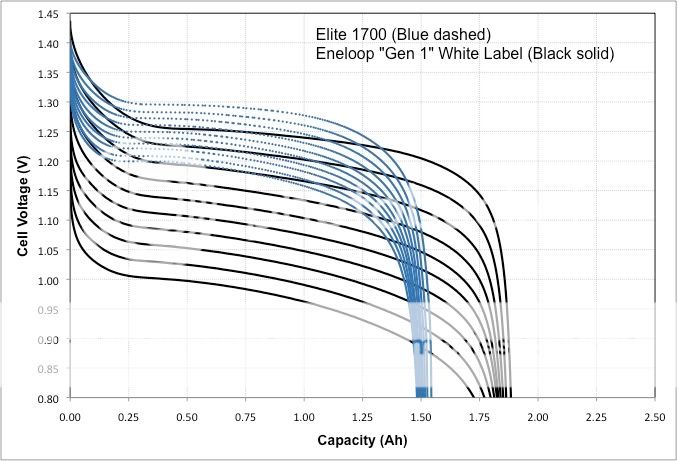
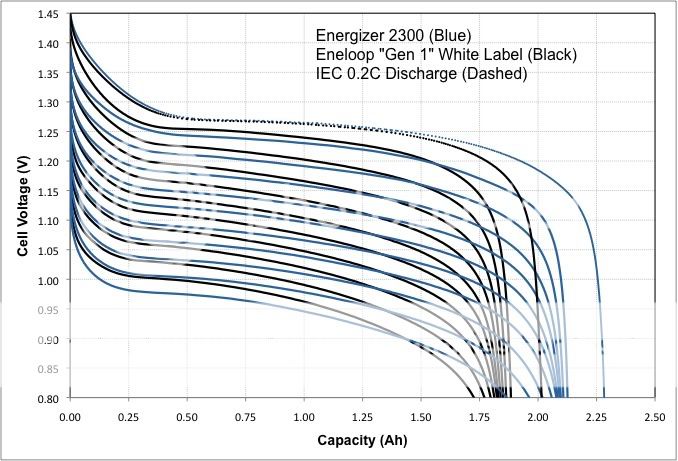
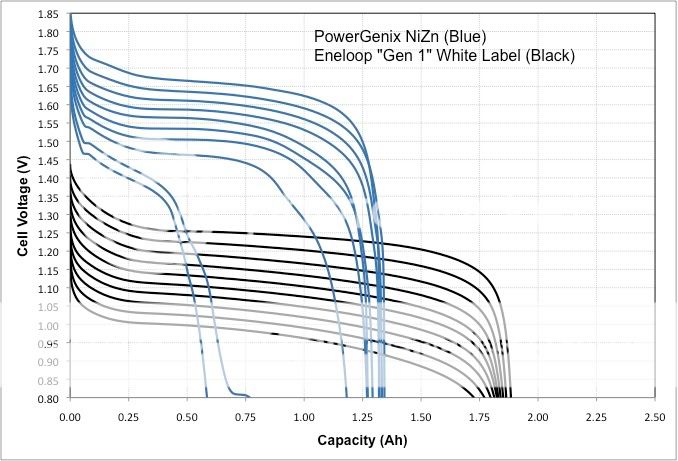
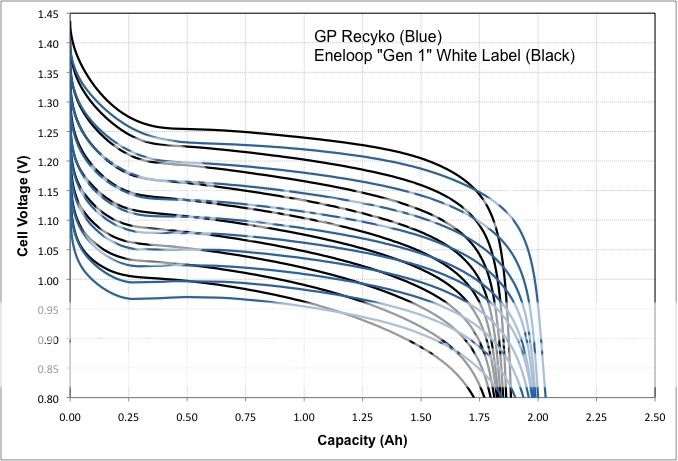
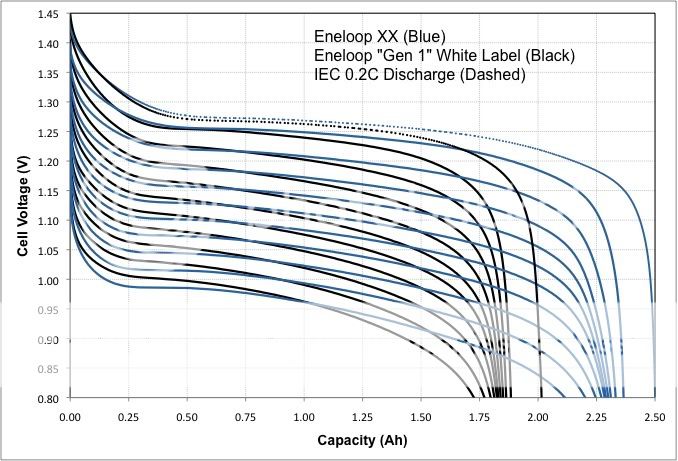
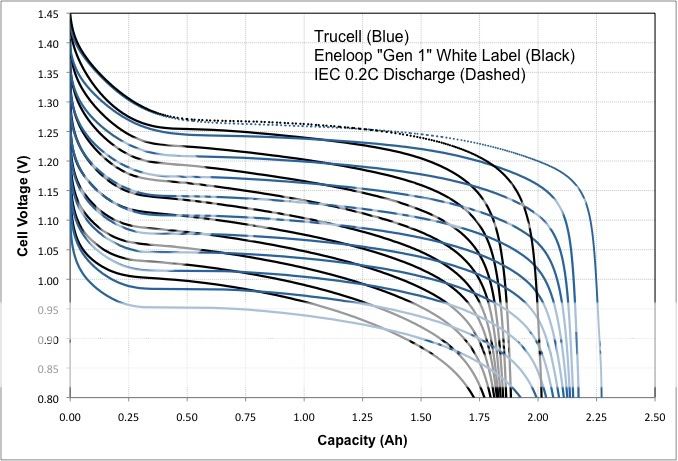
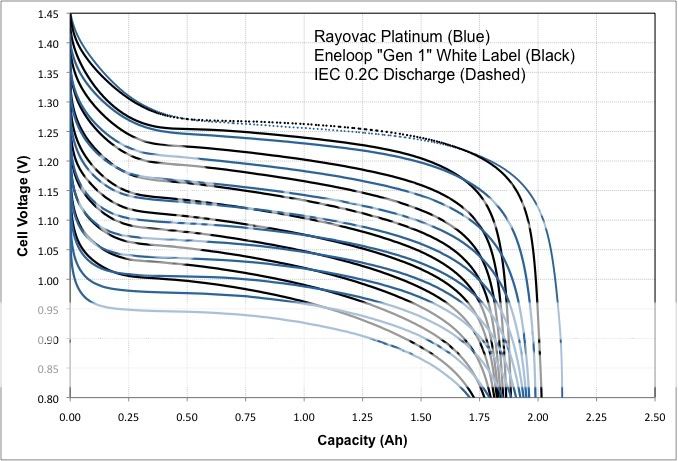
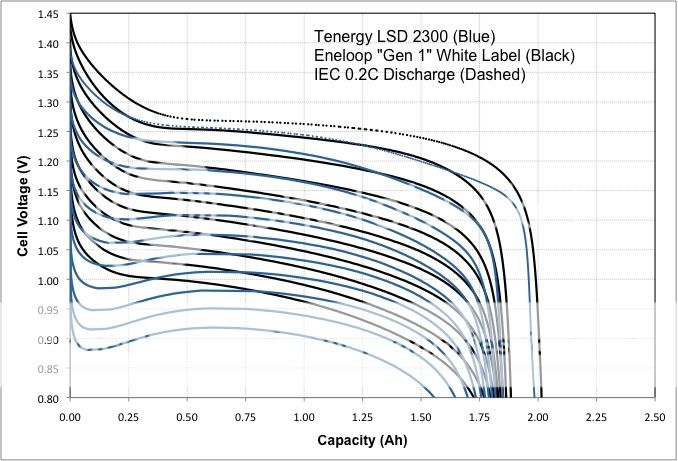
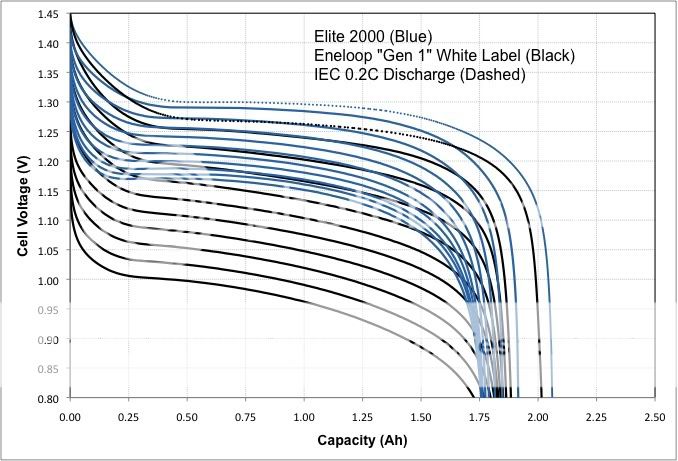
Each plot will show the performance of the cell under constant current discharge conditions compared to a "control" cell. The control cell that I have chosen is the "Gen 1" white label Eneloop. The plots for the Eneloop are in black, and the plots for the "cell of interest" are in blue. Each plot will show the curves for 1A to 10A discharge in 1A increments. In addition, I am adding a 0.2C constant current discharge curve to some of the plots. The 0.2C discharge was conducted in accordance with the IEC capacity measurement standard. To keep the plots clean looking, I am not going to label each curve. I think that it is easy enough to figure out which curve is which.
Constant Power Discharge Results
Constant power discharge is what your battery experiences in a device that has a voltage regulator. Many LED flashlights use a voltage regulator so that the LED always "sees" the same voltage and current from the battery pack. As the battery pack is drained and the voltage of the pack decreases, the current draw on the pack increases to maintain a constant voltage and current for the LED.
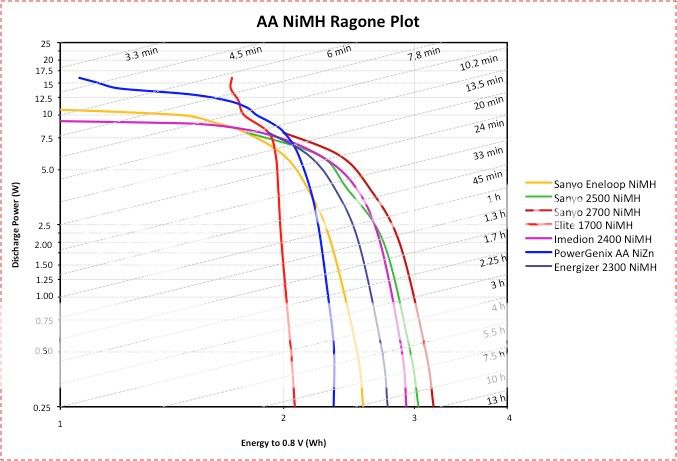
The constant power results are presented in the form of a Ragone plot. If you are not familiar with Ragone plots, read the Intro to Ragone plot thread. Ragone plots are a great way to compare the performance of several batteries under various constant power loads on the same plot.
Most of the cells will be discharged up to 8W. I have taken a few cells above 8W, notably Eneloops, Elite 1700, PowerGenix and Imedion 2400. However, limitations of my test equipment make it difficult to go above 8W, so unless it is specifically requested, expect all future results to go up to 8W.
Here is the Ragone plot for the NiMH cells I have tested so far. I know that technically the PowerGenix cell is not an NiMH type, but it is often used in applications where an NiMH might be used so I thought that I would include it.
Here are the constant current discharge curves.
Elite 1700: One break-in cycle was run on a C9000 prior to testing. Please note that these tests were performed on Elite 1700 cells purchased back in June 2010. Testing of more recent Elite 1700 cells has shown that they perform less well at high currents. For a comparison between the new and old Elite 1700 cells, see the end of this thread.
Energizer 2300 Tested fresh out of the package.
Shnoopaloops: One break-in cycle was run on a C9000 prior to testing. These are Duraloops purchased from Shnoop. They are essentially three year old Eneloops. See here for the thread to read more detail.
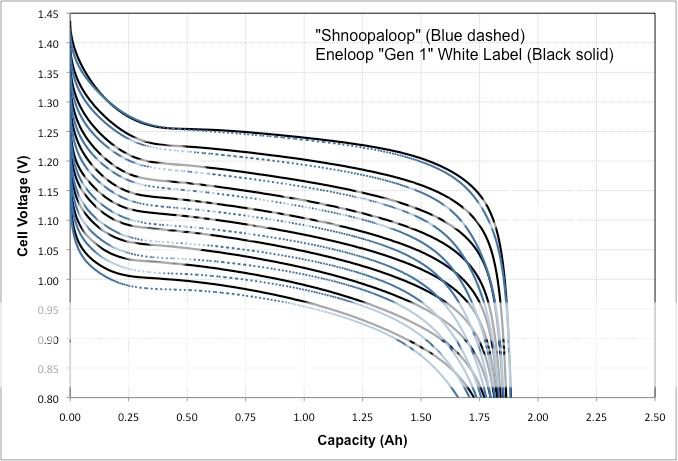
"Gen 2" 1500x Eneloop: Tested fresh out of the package. Please note that this graph does NOT have a 1 amp discharge curve. The curves shown are from 2 amp to 10 amp.

Imedion 2400: Tested fresh out of the package.
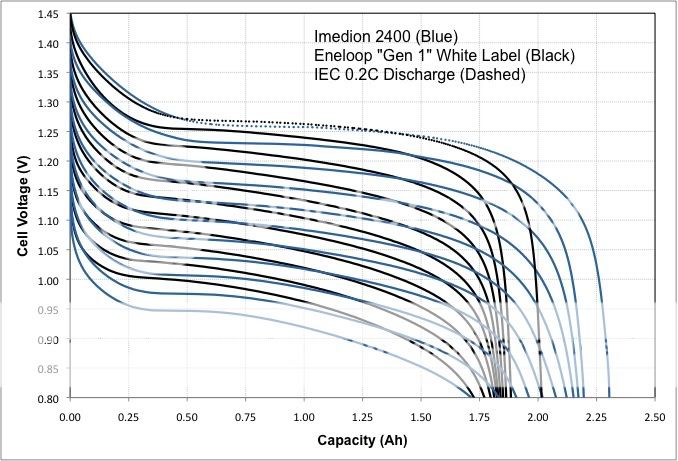
Sanyo 2700: Tested fresh out of the package.
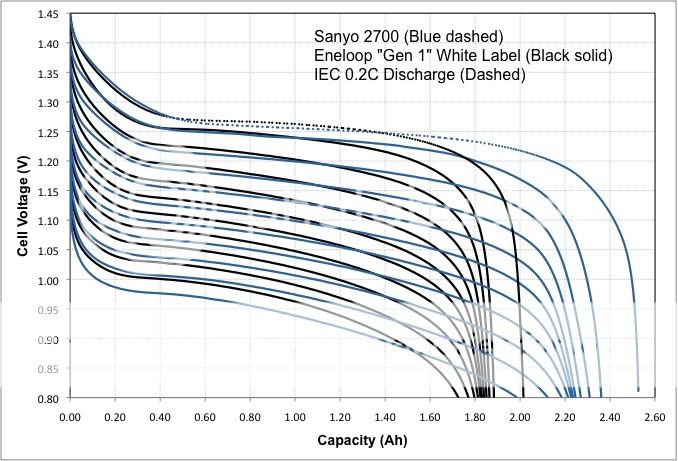
Sanyo 2500: Tested fresh out of the package.
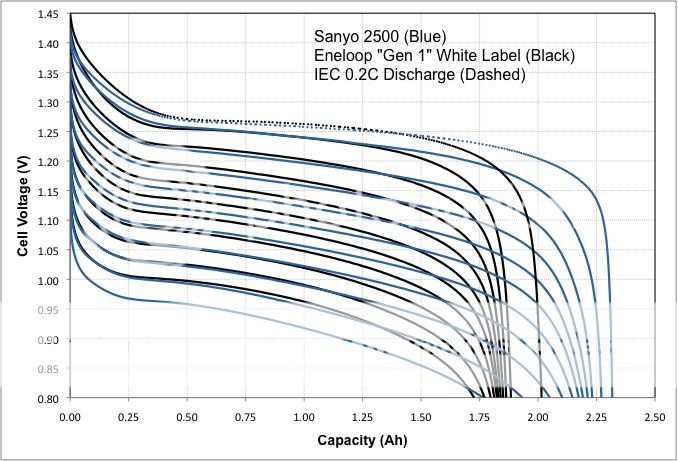
PowerGenix NiZn: Tested fresh out of the package. Please note that the voltage axis is scaled differently than the other comparisons.
GP Recyko: Tested fresh out of the package
Eneloop XX: Tested fresh out of the package. A special thanks to CPF member *Dusty* who shipped me cells all the way from Northern Ireland for this testing! :thanks:
TruCell: Two of these cells were sent to me by CPF member TurboBB.
Rayovac Platinum: Tested fresh out of the package.
Tenergy 2300 LSD: Tested fresh out of the package.
Elite 2000: These appear to perform as advertised, but don't hold their voltage quite as well as the original Elite 1700s
Edit: New January 5, 2011
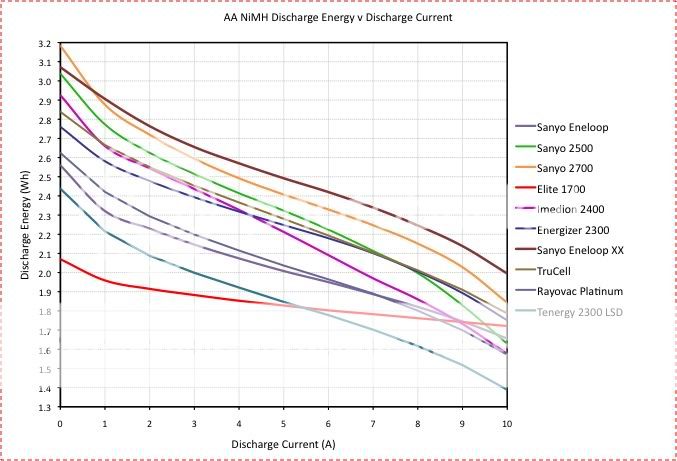
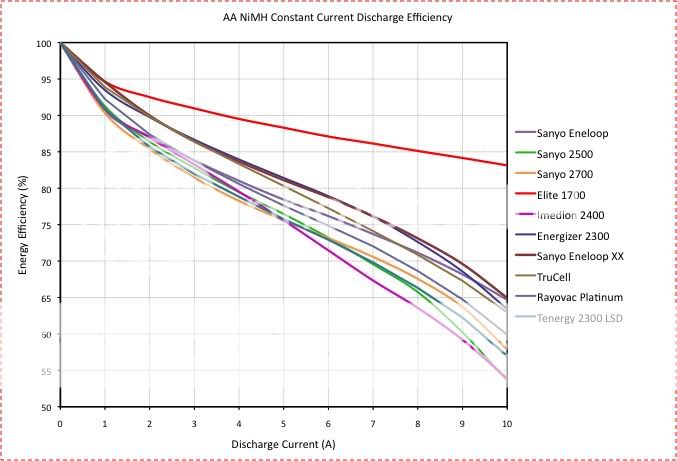
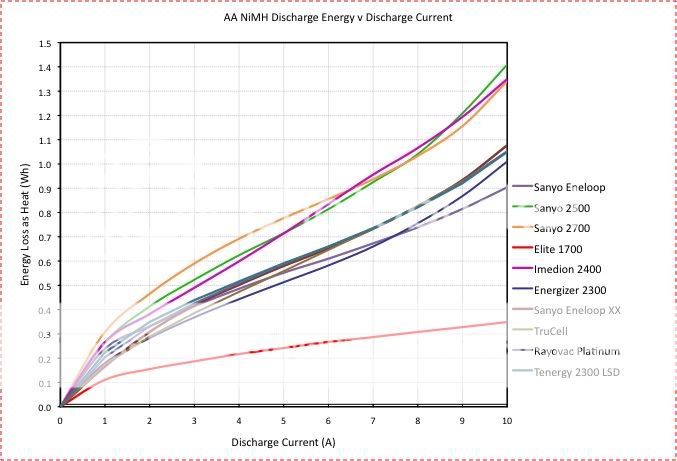
I was looking over some of my test data and realized that I could extract some additional information that might be of interest to CPF members. In particular, the total discharge energy (Wh) available as a function of discharge current, the efficiency (percent of total available energy) as a function of discharge current, and the energy loss as heat as a function of discharge current. I have included these plots below for your consideration.
Discharge Energy (Wh) vs Discharge Current (A)
Energy Efficiency (%) vs Discharge Current (A)
Energy Loss as Heat (Wh) vs Discharge Current (A): I think that this is a rather interesting plot. The amount of energy lost in the form of heat will determine how hot a battery will get during discharge. The higher the energy loss, the hotter the battery will get (assuming that all of these cells have similar heat capacities).
Hope you find this useful. If there are other NiMH cells of interest, let me know and I will do my best to test them. However, it is not my intention to do this testing on every available NiMH cell on the market, only the more common ones that are of general interest to the CPF community.
Cheers,
BG
I have been doing a lot of performance tests on AA NiMH cells recently and posting the results in various threads. I thought that it might be nice to put these results all in one place and update it as more come in.
I hope that this data set will be a nice complement to the comprehensive and exhaustive testing that Silverfox has performed in his NiMH Shootout.
My purpose here is to provide a bit more detailed test results on the more popular NiMH batteries.
Test Setup
All cells are discharged on a Maccor series 4300 battery tester. Nickel tab strips are spot welded to each cell to minimize contact resistance. Unless otherwise noted, cells are discharged to a 0.8 V cut-off. All cells were purchased new and tested within a few weeks of receipt. With the exception of the Elite 1700s and Shnoopaloops, all cells were tested fresh out of the package. The Elite 1700s and Shoopaloops went through one break-in cycle on a Maha C9000 prior to testing. Cells are charged at a 1C rate with a 10 mV -dV cut-off, then allowed to rest for 1 hour prior to discharging.
Limitations
One cell is hardly what I would call a statistically significant sample. There is certainly going to be variability in cell performance, so please recognize this limitation. Unfortunately, I do not have the time to repeat this work on multiple samples. Also, this testing does not take into account performance degradation that occurs over time due to aging and cycling (except for the Shnoopaloop constant current tests). These results are what you might expect for new cells. Exactly how the cells degrade will depend on the cell design, manufacturing quality and your use/abuse pattern.
In other words, your mileage may vary.
Constant Current Discharge Results
Constant current discharge is very close to what a battery sees in an incan hotwire flashlight. For these types of unregulated lights, you really want to know what the voltage of the cell is under load so that you can match it to the bulb output. I hope that these curves serve to compliment the excellent tests that LuxLuthor performed on incan bulbs, the results of which are posted here.
Each plot will show the performance of the cell under constant current discharge conditions compared to a "control" cell. The control cell that I have chosen is the "Gen 1" white label Eneloop. The plots for the Eneloop are in black, and the plots for the "cell of interest" are in blue. Each plot will show the curves for 1A to 10A discharge in 1A increments. In addition, I am adding a 0.2C constant current discharge curve to some of the plots. The 0.2C discharge was conducted in accordance with the IEC capacity measurement standard. To keep the plots clean looking, I am not going to label each curve. I think that it is easy enough to figure out which curve is which.
Constant Power Discharge Results
Constant power discharge is what your battery experiences in a device that has a voltage regulator. Many LED flashlights use a voltage regulator so that the LED always "sees" the same voltage and current from the battery pack. As the battery pack is drained and the voltage of the pack decreases, the current draw on the pack increases to maintain a constant voltage and current for the LED.
The constant power results are presented in the form of a Ragone plot. If you are not familiar with Ragone plots, read the Intro to Ragone plot thread. Ragone plots are a great way to compare the performance of several batteries under various constant power loads on the same plot.
Most of the cells will be discharged up to 8W. I have taken a few cells above 8W, notably Eneloops, Elite 1700, PowerGenix and Imedion 2400. However, limitations of my test equipment make it difficult to go above 8W, so unless it is specifically requested, expect all future results to go up to 8W.
Here is the Ragone plot for the NiMH cells I have tested so far. I know that technically the PowerGenix cell is not an NiMH type, but it is often used in applications where an NiMH might be used so I thought that I would include it.

Here are the constant current discharge curves.
Elite 1700: One break-in cycle was run on a C9000 prior to testing. Please note that these tests were performed on Elite 1700 cells purchased back in June 2010. Testing of more recent Elite 1700 cells has shown that they perform less well at high currents. For a comparison between the new and old Elite 1700 cells, see the end of this thread.

Energizer 2300 Tested fresh out of the package.

Shnoopaloops: One break-in cycle was run on a C9000 prior to testing. These are Duraloops purchased from Shnoop. They are essentially three year old Eneloops. See here for the thread to read more detail.

"Gen 2" 1500x Eneloop: Tested fresh out of the package. Please note that this graph does NOT have a 1 amp discharge curve. The curves shown are from 2 amp to 10 amp.

Imedion 2400: Tested fresh out of the package.

Sanyo 2700: Tested fresh out of the package.

Sanyo 2500: Tested fresh out of the package.

PowerGenix NiZn: Tested fresh out of the package. Please note that the voltage axis is scaled differently than the other comparisons.

GP Recyko: Tested fresh out of the package

Eneloop XX: Tested fresh out of the package. A special thanks to CPF member *Dusty* who shipped me cells all the way from Northern Ireland for this testing! :thanks:

TruCell: Two of these cells were sent to me by CPF member TurboBB.

Rayovac Platinum: Tested fresh out of the package.

Tenergy 2300 LSD: Tested fresh out of the package.

Elite 2000: These appear to perform as advertised, but don't hold their voltage quite as well as the original Elite 1700s

Edit: New January 5, 2011
I was looking over some of my test data and realized that I could extract some additional information that might be of interest to CPF members. In particular, the total discharge energy (Wh) available as a function of discharge current, the efficiency (percent of total available energy) as a function of discharge current, and the energy loss as heat as a function of discharge current. I have included these plots below for your consideration.
Discharge Energy (Wh) vs Discharge Current (A)

Energy Efficiency (%) vs Discharge Current (A)

Energy Loss as Heat (Wh) vs Discharge Current (A): I think that this is a rather interesting plot. The amount of energy lost in the form of heat will determine how hot a battery will get during discharge. The higher the energy loss, the hotter the battery will get (assuming that all of these cells have similar heat capacities).

Hope you find this useful. If there are other NiMH cells of interest, let me know and I will do my best to test them. However, it is not my intention to do this testing on every available NiMH cell on the market, only the more common ones that are of general interest to the CPF community.
Cheers,
BG
Last edited:
